When I was a mud logger many years ago, we would often do gas ratio
analysis to estimate hydrocarbon types based on thermal maturity. There are
certain rules of ratios that can indicate what the hydrocarbon type(s) will be
when the well is produced. It was a simple plotting exercise of calculating
ratios of alkanes/NGLs, such as ethane and propane, through a hydrocarbon show
during drilling and comparing them to a chart. The information could be used to
predict whether hydrocarbons would be productive and, if so, what hydrocarbon
type(s) would be produced. Gas ratio analysis is considered to be a geochemical
technique. Basically, all that is needed for gas ratio analysis is a gas
detection and measurement system and a gas chromatograph that gives levels of
light alkanes from methane (C1) to pentane (C5). This is a standard mud logging
unit setup. A gas detection system utilizes a gas trap with an agitator to
collect gas from the drilling mud and pumps it into a detector, which measures
the magnitude of gas shows. The chromatograph breaks the gas down into
percentage components of the total gas. While such analyses are not generally
needed in development drilling, they can be important for exploratory drilling
or wildcat wells. Such analysis can also help with optimizing the choice of
perforation zones. A typical setup is shown below. I remember when I first used
the new quantitative gas measurement (QGM) agitator that was developed by
Texaco. It was powered by electricity and was deemed shockproof. I also
remember walking past it one time, getting shocked by it without even touching
it! When examining gas from a mud log one must compensate for background gas –
the steady gas already coming into the mud system before the gas shows being
evaluated, and gas from individual events in drilling such as when making a
connection (connection gas) and following a trip out and back in the wellbore
(trip gas).
B.O. Pixler wrote about gas ratio analysis
in a 1969 article in the Journal of Petroleum Technology. In describing the
methodology, he noted the basis for gas detection analysis:
“Ordinarily, when formation cuttings are drilled they retain much of
the formation pore fluid. This fluid is released to the mud column as the
cuttings travel up the annulus. Most of the formation fluid in the cuttings
will be "produced" into the drilling mud during the top 500 ft of
hole travel. Conventionally, a mud sample is diverted to a mechanically
operated gas trap to obtain a sample of the gas in the mud. The efficiency of
this trap is from 15 to 70 percent, depending upon the gel strength of the mud,
the amount of mud flowing through the trap and the rotation speed of the trap
impeller.”
Some very good papers and analyses
illustrating the value of gas ratio analysis have come out in the past decade
or so. A case study from a fractured carbonate reservoir in a Kuwait oil field
from a 2012 AAPG conference covers fluid detection and gas analysis. The paper
noted that gas detection during drilling and further analysis was “particularly
significant in exploration of high pressure, tight, fractured carbonate
reservoirs in Kuwait, which are drilled with Oil Base Mud (OBM) having high
barite content causing severe formation damage.” The data is important for
formation evaluation, identification of productive intervals, fluid
characterization, and identification of gas/oil and oil/water contacts. Factors
that may affect gas readings include the diameter of the hole, the size of the
chamber holding the agitator, mud properties and mud additives, the distance
between the gas trap and the wellbore, and the nature of the reservoir. Another
paper describes even more factors: “volume of gas per unit volume of
formation; degree of formation flushing; rate of penetration; mud density and
mud viscosity; formation pressure; gas trap efficiency; gas detector
efficiency; variability of mud flow rate.” Thus, we can see that comparing
ratio analyses from different wells would give the best data if those
parameters were similar, and that interpretation of the data is
qualitative rather than quantitative.
The first gas ratio analysis is known as
the gas quality ratio and simply divides total gas (TG) by all the other
alkanes (C2-C5) combined.
Gas Quality Ratio = GQR = TG / (C1 + 2*C2 + 3*C3 + 4*(iC4 + nC4) + 5*(iC5
+ nC5))
The gas quality ratio is used to determine the quality of the gas data
and eliminate data that is the result of contamination in the mud system and
gas from non-productive zones. The plot below shows C1 versus C1/C2 + C3 + C4 +
C5 and applies a cutoff to eliminate gas from contamination.
Other gas ratio analysis equations are shown below:
Gas dryness = C1/C1+C2+C3+C4+C5
Pixler ratios (C1/C2, C1/C3 and C1/C4)
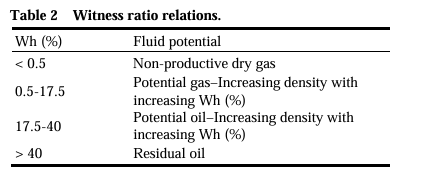
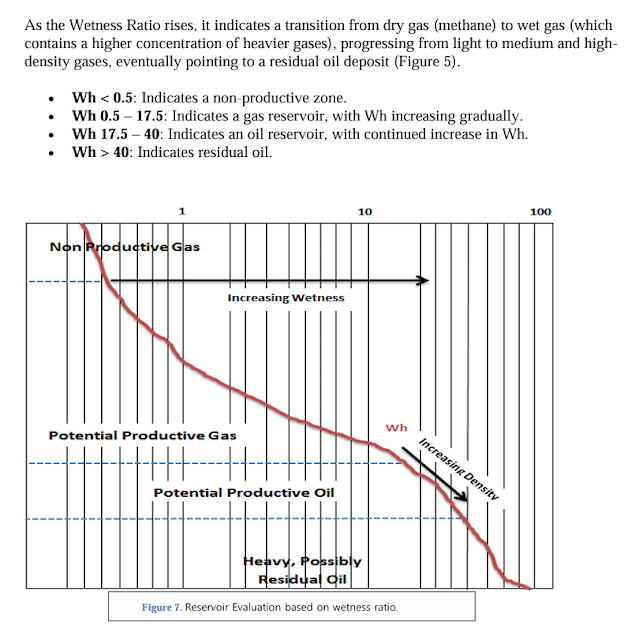
Wetness (Wh) = 100 * (C2 + C3 + C4 + C5) / (C1 + C2 + C3 + C4 + C5)
Balance (Bh) = (C1 + C2) / (C3 + C4 + C5)
Character (Ch) = (C4 + C5) / C3
These are used to determine fluid type, contacts, and evolution. The
authors explain as follows:
“The first equation, gas dryness C1/Sum is a good indication for the
wetness of the gas, the fluid evolution, and the discontinuities in the fluid.
The second method, Pixler ratios, the magnitude of the methane to ethane ratio
determines if the reservoir contains oil, gas or water or if its nonproductive
water zone (Pixler 1969). Also from Pixler ratio slope line used to indicate
permeability of reservoir as steep slope indicate tight zone. The third method
is the relation between wetness and balance that allows us to determine quality
and productivity of hydrocarbon contained in drilling fluid. Regarding to
character ratio, the presence of a dense hydrocarbon fluid can be confirmed and
this should aid in the distinction of a very wet gas from very high gravity oil.”
The graphs and tables below are from a 2015 study of gas ratio analysis in the Hovsan Oil Field in Azerbaijan from a paper in the Journal of Geological Resource and Engineering. The first one is a blank graph similar to the ones we used to use for plotting.
A newer paper from 2024 in the Global Scientific Journal explores gas ratio analysis in a field in Oman. Graphs and figures from the paper are shown below. The first one shows a typical gas trap setup and a typical mud log/gas chromatograph plot.
Geochemist Sheng Wu has done some
interesting work comparing gas ratio analyses for shale gas and oil in
different reservoirs. He notes the difference of the Vaca Muerta shale from
other type I marine basins:
“Vaca Muerta fits a type I as many US marine type I, but the GOR and
API differ significantly for the same vRo.”
He notes that the wetness ratio of the Vaca Muerta remains constant,
which does not conform to the normal wetness-maturity pattern. He thinks this
is due to the hypersaline nature of the reservoir fluids and a “PVT process
that altered the dissolved gas in the shale oils.”
“The value of using isotope is not just to get maturity, but also to
compare with wetness, API and GOR data to find out the correct source rock type
and then use the correct template for maturity, wetness, API and GOR
correlation.”
Wu also did some work in the Marcellus wet
gas window, determining that PVT separation occurred in those areas as
evidenced by abnormal gas ratios, particularly the gas wetness ratio exceeding
50%.
“If operators could further optimize the landing and drilling of the
lateral targeting the exact PVT separated liquid part and gas part separately,
we could have improved recovery for both liquid and gas as well as have a
better prediction of the NGL production.”
He notes a paper by Dr. Walker about abnormal behavior in wet gas
production in the Eagle Ford that was explained as adsorbed methane release,
but that he thinks is due instead to PVT separation. I do know that the
Marcellus formation has a high degree of adsorbed gas compared to many other
formations, including shales. However, he thinks that the abnormally high gas
wetness in both formations is the result of
“PVT induced oil ring producing simultaneously with some gas tops for
starting GOR at 3MCF/bbl.”
Finally, he notes that gas isotope logging in real-time or near
real-time is available as an added mud logging service and can help delineate
wet gas producibility by precise zone targeting.
“Here we showed that isotope-maturity-wetness-GOR/CGR-PVT relationship
could subtly & substantially change the production and isotope logging
coupled with other geochemical logging and modeling tools could give
unprecedented maturity resolution and also to each foot in the drilling,
vertical or lateral. Plus, well-site isotope mud logging is available now to
delineate every foot of the lateral or vertical at a fractional cost of
laboratory based isotope analysis now.”
Wu's work shows the value of gas ratio analysis in deeper geochemical analysis, which I admit, is difficult to comprehend fully without a strong background in hydrocarbon geochemistry.
References:
East
Ohio PVC monomer derailment, wet shale gas production in Appalachian, Eagle
Ford, Permian and relation to isotope applications. Sheng Wu. March 23, 2023.
LinkedIn. (18) East Ohio PVC monomer
derailment, wet shale gas production in Appalachian, Eagle Ford, Permian and
relation to isotope applications | LinkedIn
The
isotope-maturity-wetness of shale oil & gas. Sheng Wu. July 22, 2023.
LinkedIn. (18) The isotope-maturity-wetness of
shale oil & gas | LinkedIn
Application
of Gas Ratio Analysis in Reservoir Evaluation – Case Study in Burhan Land
Field, Burhann, Oman. Ahmed Meneassy. Zubair Oil and Gas, Muscat, Oman. Global
Scientific Journals. Volume 12, Issue 8, August 2024, Online: ISSN 2320-9186. *Application_of_Gas_Ratio_Analysis_in_Reservoir_Evaluation_Case_Study_in_Burhan_Land_Field_BURHANN_OMAN.pdf
Gas
Ratio Analysis in Hovsan Oil Field. Samir Hashimov. Journal of Geological
Resource and Engineering 1 (2015) 42-48 doi:10.17265/2328-2193/2015.01.006. Microsoft Word - 6-JGRE20141102-1
Fluid
Detection in Carbonate Reservoirs utilizing Gas Analysis-A Case Study. Ali Abu
Ghneej, Jalal Dashti, Badruzzaman Khan, Heyam Ammar, Abdulrazaq AL-Nabhan,
Sunil K. Singh, Talal Al-Adwani, and Nacif Marai. AAPG Search and Discovery
Article #41116. February 28, 2013. *Adapted from extended abstract prepared in
conjunction with poster presentation at AAPG International Convention and
Exhibition, Singapore, 16-19 September 2012. Fluid Detection in Carbonate
Reservoirs utilizing Gas Analysis-A Case Study; #41116 (2013)
Formation
Evaluation by Analysis of Hydrocarbon Ratios. B.O. Pixler. Journal of Petroleum
Technology. 21 (06): 665–670. Paper Number: SPE-2254-PA. June 1, 1969. Formation
Evaluation by Analysis of Hydrocarbon Ratios | Journal of Petroleum Technology
| OnePetro


No comments:
Post a Comment