Blog Archive

Saturday, August 31, 2024

Incentivizing New Dispatchable Generation: Controversial but Useful


     The creation of the Texas Energy Fund to invest in and basically subsidize baseload, or rather dispatchable power generation has resulted in low-interest loans being selected to help build 17 new natural gas plants totaling 9.781 MW of capacity. Thus far 72 applications have been received for loans. These plants are approved for $5.38 billion in loans. The fund is not limited to natural gas but is dominated by natural gas because that is the most desirable dispatchable resource based on reliability and other factors. As the graphic below shows most of this new generation will be derived from simple cycle and internal combustion reciprocating gas engine plants. Less will go to combined-cycle gas plants, which are more efficient but less flexible.  After a four-to-eight-month diligence phase, which is scheduled to span between four to eight months, the loan agreements will be finalized and first disbursements are expected by the end of 2025. Power Magazine’s Sonal Patel explains:

The TEF loans, which must have a term of 20 years with an interest rate of 3%, may be used to either finance upgrades to existing dispatchable generation facilities that increase capacity by at least 100 MW or fund the construction of new dispatchable generation projects with a minimum capacity of 100 MW. Eligible new projects, notably, also qualify for a completion bonus grant of up to $120,000 per MW if interconnected by June 1, 2026, or up to $80,000 per MW if interconnected before June 1, 2029.”


Source: Power Magazine


     ERCOT is facing high load demand growth in the years to come, and this is combined with the problems with reliability revealed by 2021’s winter storm and regular hot weather events that strain the grid. Below is a graph showing expected capacity additions. Remember this is capacity so the lower natural gas capacity has a utilization rate (capacity factor) nearly double that of wind and nearly triple that of solar. Solar and wind are operated at full capacity unless over-generating, while natural gas, especially in simple cycle peaking plants, is throttled up and down as demand increases and decreases, resulting in downtime when demand is low. This forced downtime means that returns of investment are forced down as well. The need to back up solar and wind forces the utilities to build less efficient and more carbon-intensive simple cycle combustion turbines and reciprocating gas engine peaking plants. While storage and renewables are very important resources in Texas, they do decrease overall reliability and trigger the need for new investments in dispatchable resources.


     The PJM power market’s recent capacity auction prices indicate a strong need for new generation in the region. Wind and solar are not likely to make up much of that needed supply so states may move in a similar direction as Texas did. In Pennsylvania, it was recently reported that “Sen. Gene Yaw, R-Williamsport, shared his proposal to create a Pennsylvania Baseload Energy Development Fund, which would give low-interest grants and loans to electricity generators to build, maintain, modernize, and run their plants.” He argues that since Pennsylvania provides about 25% of PJM’s baseload generation and there is a need for more, then incentivizing dispatchable generation makes sense. PJM expects more coal retirements and more old gas retirements in the years ahead and needs replacement baseload plants. Current high interest rates are also affecting new plant financing. For PJM it was pointed out that “of the 162,000 megawatts in the queue, solar and wind comprise 83,000 megawatts and another 50,000 megawatts are energy storage projects. Natural gas projects account for fewer than 5,000 megawatts.” Clearly, there is a need for more natural gas plants in PJM and as coal plants are retired that need will grow. It is not unlikely that some coal plant retirements may be delayed.

      One could make a very good argument that states incentivizing dispatchable generation is not just increasing reliability but also keeping costs lower for ratepayer consumers. Reliability needs to be ensured one way or another. Reliability investments can be difficult because they are often responses to short-lived demand or short-lived weather and temperature events. That means that reliability investments may have short-lived utilization and very low overall utilization rates as is common for gas peaking plants. Investing in these plants is often not profitable for utilities. Thus, incentives are welcome. One might call these investments fossil fuel subsidies, but their functions often involve backing up variable renewable power and replacing it as it goes offline at night for solar or in low wind times. Backup is necessary. Thus, these investments are also a hidden subsidy for renewables since without the variability of renewables many would not be needed.


References:


Natural gas subsidy plan rolled out to stabilize the grid. Anthony Hennen. The Center Square. August 30, 2024. Natural gas subsidy plan rolled out to stabilize the grid (msn.com)

Texas Moves Forward with $5.38B in Loans for 10 GW of New Dispatchable Power Projects. Sonal Patel. Power Magazine. August 29, 2024. Texas Moves Forward with $5.38B in Loans for 10 GW of New Dispatchable Power Projects (powermag.com)

Graphics of the Week: Oil & Gas from Frontier Basins Increases, Thermal Plasma Methods for Various Mineral Recovery, Lifecycle Costs of Clean Energy Technologies, U.S. Agricultural Trade Balance, High Valuable Metal Concentrations Found in URO’s Beryllium Project in Australia, Gas Production by Major Oil Companies Continues to Drop, and Percentages By Country of Light Sweet Crude Imported to Europe by Sea

Graphics of the Week: Oil & Gas from Frontier Basins Increases, Thermal Plasma Methods for Various Mineral Recovery, Lifecycle Costs of Clean Energy Technologies, U.S. Agricultural Trade Balance, High Valuable Metal Concentrations Found in URO’s Beryllium Project in Australia, Gas Production by Major Oil Companies Continues to Drop, and Percentages By Country of Light Sweet Crude Imported to Europe by Sea


This batch includes eight graphics in seven contexts, including two tables.

The first graph was posted on LinkedIn by Rystad Energy showing the percentage of new oil & gas from basins of different maturity levels from mature to frontier to emerging. It shows a recovery in 2024 from low levels in 2023 of new oil & gas from frontier and emerging basins. This is important as it can be seen that 2023 was by far the lowest year for frontier and emerging basin production. Rystad pointed out that this is to be expected since new discoveries in frontier basins can potentially be more economical which is a key incentive to explore.


Graphic #2 is a table posted to a LinkedIn Waste to Energy Group. It is a table of Thermal Plasma Methods for Various Mineral Recovery. It shows the methods of recovery and materials from which metals are being recovered including post-consumer electronic waste, mineral processing and industrial waste, radioactive waste, and red mud which refers to a mineral processing waste that is left over from the conversion of bauxite ore to alumina. Electroplating sludge produces large volumes of wastewater laden with heavy metals. Galvanization, the process of coating steel with aluminum to protect it from corrosion, also produces wastewater with high toxicity from heavy metals. High heat levels are required for the separation processes. In several cases, the hot plasma enables the chemical reduction of oxidized wastes.   


Graphic #3 is Lifecycle Costs of Clean Energy Technologies posted by the IEA. This one compares the upfront costs plus the operating costs of ICE vs. EV cars in Europe, 2-wheel ICE vs. 2-wheel EV motorbikes in India, and gas boiler + air conditioner vs. heat pump in the U.S. Upfront costs are marginally higher for the cleaner technologies except for heat pumps, which have slightly cheaper upfront costs compared to gas boiler plus a/c. I think the point is that EVs and heat pumps are reasonably close to parity and by some measures have achieved it. While ICE technology and natural gas efficiency technology continue to improve, so do EV efficiency and heat pump efficiency. Perhaps when solid-state batteries and other designs are deployed, we will see that EVs can achieve parity. I have always said that the 2030s will be when EVs are more widely adopted unless some real breakthroughs occur in ICE technology. EVs still need to overcome some lingering range issues and charging issues. Heat pumps need to overcome low-temperature limitations and increase system lifespans. These changes are occurring, and when they are overcome, they will compete even better.


Graphic #4 is the projected U.S. Agricultural Trade Balance. The source is the USDA and the Senate GOP Ag Committee. The graph shows we entered an agricultural trade deficit in early 2023 and that is set to continue to increase through 2024. This is being led by steep drops in exports of horticultural goods (presumably fruits and vegetables) and sugar and tropical goods. The data does not show deficits in any other sectors. The drop in horticultural exports is quite steep. Most U.S. agricultural exports go to Canada, Mexico, China and to a lesser extent Europe and Japan. Most of our agricultural imports come from Canada, Mexico, and Europe.  


Graphic #5 was posted in the Exploration Geologist LinkedIn group. It shows a new beryllium discovery showing “some of the highest Bertrandite readings ever found on surface globally” and “high gold and silver prospectivity with high antimony and bismuth.” The project referenced in URO’s Arunta Beryllium Project in Western Australia. The table shows the concentrations of different important metals.


Graphic #6 was posted by Energy Analytics showing the declining natural gas production of major oil companies. They pointed out in the post that national companies like Rosneft and PetroChina have increased production. This likely has to do with the development of natural gas infrastructure and utilities in China vs. places like the U.S. where natural gas remains at high supply levels and oil is more profitable. It also looks like BP and Chevron have actually seen steady or increasing gas production, so the trend is not across the board.


Graphics #7 and #8 show the percentages of Light Sweet Crude being imported to Europe by sea. This is a Rystad Energy post. The second graph shows that 16% of those imports come from North Africa, or Libya in this case. Libya is the second highest source of light sweet crude after the U.S. Will the U.S. increase exports? Libyan supply is currently under threat due to the conflict there and an alternative source may be needed.


References:


Outlook for U.S. Agricultural Trade: U.S. Agricultural Exports in Fiscal Year 2025 Forecast at $169.5 Billion; Imports revised upwards to $212.0 Billion. USDA. Economic Research Service. USDA ERS - Outlook for U.S. Agricultural Trade

Rystad Energy

International Energy Agency

Energy Analytics

Thursday, August 29, 2024

Biosolids-Derived Fertilizers: Pros, Cons, and Sewage Treatment Biosolids Post-Incineration Ash as Fertilizer: A Successful Project in Northeast Ohio


     Biosolids are the separated solid end components of the wastewater treatment process that are physically and chemically treated. The result is semi-solid nutrient-rich biosolids. In most cases, biosolids are basically treated sewage sludge. Biosolids have long been used as a land application treatment that increases soil fertility but there are many potential problems with the chemical content of the biosolids such as high levels of heavy metals, PFAS, dioxins, organic chemicals, and microplastics. Human pathogens are also a concern since some thrive in sewage and can be difficult to eliminate. They also contain phosphorus and carbon that are good for plants and soil. That is one reason why land application of biosolids is the fate of most biosolids as shown below. It should be remembered that it is not just human bodily wastes that end up at sewage treatment plants but whatever is dumped down a sink, including known illegal dumping. This may include toxic chemicals.

     Biosolids are either land-applied or disposed of via incineration or landfilling. The share of each is shown below. The ash left over from incineration is also typically landfilled.


     There are different classes of biosolids based on how the wastewater is treated or utilized. The EPA's classification scheme of Class B, Class A, and Class A-Exceptional Quality is shown below.


     The different types are given below based on a Canadian study of potential emerging contaminants from biosolids.


Anaerobic Digestion: Micro-organisms decompose the sludge in the absence of oxygen either at mesophilic (at 35 °C) or thermophilic (between 50° and 57 °C) temperatures.

Aerobic Digestion: Micro-organisms decompose the sludge in the presence of oxygen either at ambient and mesophilic (10 °C to 40 °C) or auto-thermal (40 °C to 80 °C) temperatures.

Composting: A biological process where organic matter decomposes to produce humus after the addition of some dry bulking material such as sawdust, wood chips, or shredded yard waste under controlled aerobic conditions.

Alkaline Treatment: The sludge is mixed with alkaline materials such as lime or cement kiln dust, or incinerator fly ash and maintained at pH above 12 for 24 hours (for Class B) or at temperature 70 °C for 30 minutes (for Class A).

 Heat Drying: Either convention or conduction dryers are used to dry the biosolids

 Dewatering: The separation of the water from biosolids is done to obtain a semi-solid or solid product by using a dewatering technologies (centrifuges, belt filter presses, plate and frame filter presses, and drying beds and lagoons).

      Some methods of biosolids composting are shown below.


     Human pathogens found in sewage wastewater include fecal coliform bacteria such as E. Coli, Salmonella sp. bacteria, enteric viruses, and viable helminth ova. The presence of these ‘indicator organisms’ suggests that the waste may be unsafe. Some have been known to survive the wastewater treatment process. EPA requires that there be no detectible level of such organisms in biosolids for land application. Concentration limits and loading rates for metals are shown below.


     Biosolids are used as a fertilizer in agriculture as well as in forests for timber land. They are also used as an additive to condition soil. They are used on reclamation sites to increase the rate of new vegetative growth. Certifiably the cleanest biosolids, Class A,  are approved for home lawn and garden use.

     The U.S. EPA requires all publicly owned treatment works (POTWs) to produce annual reports summarizing waste management practices and pollution monitoring data including contaminant levels in their waste. Nine states (Arizona, Idaho, Michigan, Ohio, Oklahoma, South Dakota, Texas, Utah, and Wisconsin) are authorized through the National Pollutant Discharge Elimination System (NPDES) Program to be the permitting authority for biosolids.

     Land application may be done in different ways and the table below compares their attributes for reclaimed land application. The land application method often depends on the consistency of the biosolids, whether they are mostly liquid or whether they are more solid granules or pellets.  


EPA also explains biosolids odors:


Biosolids may emit a distinctive odor depending on the treatment process and methods used. The odorous compounds generated and detected most often are ammonia, amines, and reduced sulfur-containing compounds. Meteorological conditions such as wind speed and direction, relative humidity, and temperature can impact nuisance odors. The presence of biosolids odors does not mean that the biosolids pose harm to human health and the environment.”

     A 2016 study published in Chemosphere evaluated the cadmium-phosphorus (Cd-P) ratios in biosolids vs. biosolids ash, or combustion residuals. Cadmium is a toxic heavy metal and it is desirable to keep its levels down. Some conclusions from the abstract are given below:


Combustion of biosolids improved the Cd/P ratio in ashes by 2–5 times, compared with the initial biosolids. The low Cd content in ashes (4–9 mg Cd (kg P)−1) makes this material a particularly attractive alternative to mineral fertilizers. Significantly higher pore water P (as well as total N) was measured in soils containing biosolids, but plants produced a higher biomass in soil fertilized with ashes. The K and Ca amendments prior to biosolids combustion generally decreased the total Cd in ash, but had little effect on P and Cd uptake and biomass growth. Similarly, the combustion temperature had negligible effect on these factors as well.”


     Another study published in the June 2023 issue of the Science of the Total Environment reviewed the challenges and opportunities of biosolids-derived fertilizers. The highlights given below indicate that there is considerable opportunity for biosolids, particularly contaminant-free biosolids, to fertilize plants, condition soil, reduce incineration ash, and increase landfill space.


•Land application of biosolids is a cost-effective way to reuse nutrient in soils.

•Ever changing nature of biosolids contaminants dictates regulatory guidelines.

•Nutrient content in biosolids provides an understanding of baseline agronomic value.

•Extractive technologies can recover and purify valuable constituents from biosolids.

•Prospects for novel granulated fertilisers derived from biosolids are significant.


     Emerging technologies like chemical extraction of desired constituents of biosolids before thermal processing are being considered more and more. This may be desirable since nitrogen and carbon compounds are destroyed during combustion. Nitrogen, phosphorous, and humic substances may be recovered in this way. The authors think this will eventually become a future trend in wastewater treatment plants. It would further the circular economy capabilities of biosolids. The graphic below from the paper compares current practices to a low-value end-use and a high-value end-use. The high-value end-use makes use of mineral and chemical recovery.


     EPA notes some important advantages of biosolids-derived fertilizers over traditional synthetic fertilizers:

The nutrients in the biosolids offer several advantages over those in inorganic fertilizers because they are organic and are released slowly to growing plants. These organic forms of nutrients are less water soluble and, therefore, less likely to leach into groundwater or run off into surface waters.”

EPA goes on to tout the overall the advantages of biosolids:

* Biosolids are a recycled product, use of which does not deplete non-renewable resources such as phosphorous.

* The nutrients in biosolids are not as soluble as those in chemical fertilizers and are therefore released more slowly.

* Biosolids appliers are required to maintain setbacks from water resources and are often subject to more stringent soil conservation and erosion control practices, nutrient management, and record keeping and reporting requirements than farmers who use only chemical fertilizers or manures.

* Biosolids are closely monitored.

* The organic matter in biosolids improves soil properties for optimum plant growth, including tilth, friability, fertility and water holding capacity. They also decrease the need for pesticide use.


Incineration of Biosolids and Biosolids Ash-to-Soil

     Incineration of biosolids involves two steps: adequate evaporation of water content, and combustion. 65-75% of the biosolids are combustible which means that biosolids ash volumes are considerably less than non-combusted biosolids. The ash is more inert than the original biosolids which may still be reactive. The combustible content means that there is no need for additional fuel except for start-up of the incinerator. The incinerated ash may have other uses such as a filler for bricks and concrete, sub-base materials for road construction, daily landfill cover (after pelletization), and as an “ingredient in footing at athletic facilities, including baseball diamonds, and equestrian facilities, such as race tracks and arenas.”

     The two main methods of incineration are multiple hearth furnace (MHF) technology and fluidized bed furnace (FBF) technology. Both have advantages and disadvantages. Back in 1993 when a higher share of biosolids was incinerated EPA noted that in 1993, 343 biosolids incinerators were in operation in the U.S. and 80% of them were MHFs and 20 percent were FBFs. Some comparisons are given in the table below.


 Northeast Ohio Regional Sewer District Biosolids Ash Land Application Project
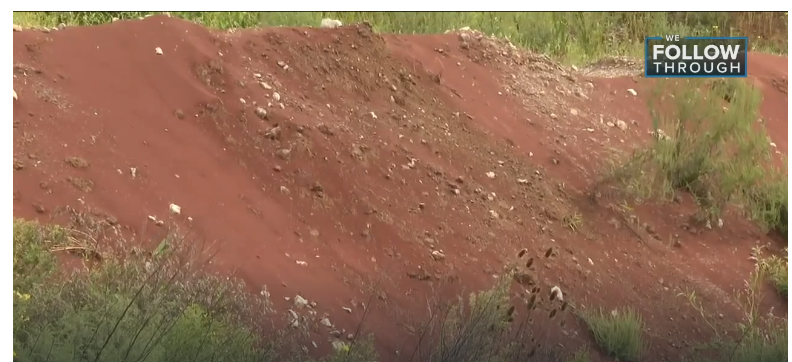
     Six years ago, a project was initiated in the Northeast Ohio Regional Sewer District to apply incinerated biosolids ash to soil for fertilization. Previously, the biosolids ash was stored in lagoons or ponds at the Southerly Wastewater Treatment plant. The sandy slurry eventually becomes a solid that looks like red clay which would later be dug out and shipped to a landfill. This project which began in 2018 was the first of its kind. Has it worked? According to the District's Robin Halperin, it has:

It's worked fantastic; seven years later, we have reused 100% of our ash, and we have not landfilled anything. We've also saved an estimated $6.5 million by not landfilling it, and we reduced our carbon emissions by 96%.

The solidified sludge is taken to Kurtz Brothers Landscape Supply which has called the project a “win-win for them, their customers who use the soil and, in a roundabout way, Lake Erie.” Since it is less likely to runoff than regular synthetic fertilizer it can help protect the lake from issues like harmful algae blooms. The District is also looking into a reuse application for the grit that is removed at the early stages of wastewater treatment. The grit is sand, rock, and gravel that finds its way to the treatment plant. It needs to be cleaned but after that, it can be reused, they say. They point out that while not all WWTPs have biosolids ash, they all have grit that must be removed because it can damage pipes and pumps. Before the project was initiated it took about a decade of testing and permitting before the Ohio EPA approved the project. The decreased CO2 emissions are a result of being able to truck the biosolids to the nearby landscaping firm instead of taking them to the more distant landfill. 


References:


Turning solid waste ash into fertilized soil proves win-win for Northeast Ohio Regional Sewer District. John Kosich. News 5 Cleveland. August 20, 2024. Turning solid waste ash into fertilized soil proves win-win NEORSD (news5cleveland.com)

Biosolids-derived fertilisers: A review of challenges and opportunities. Serhiy Marchuk, Stephan Tait, Payel Sinha, Peter Harris, Diogenes L. Antille, and Bernadette K. McCabe. Science of The Total Environment. Volume 875, 1 June 2023, 162555. Biosolids-derived fertilisers: A review of challenges and opportunities - ScienceDirect

Using Biosolids for Reclamation/Remediation of Disturbed Soils. Sally Brown and Chuck Henry. University of Washington. (U.S. EPA.) May 2015. biosolidswhitepaper-uwash.pdf

Phosphorus and cadmium availability in soil fertilized with biosolids and ashes. Jurate Kumpiene, Evelina Brännvall, Martin Wolters, Nils Skoglund, Stasys Čirba, and Vladislovas Česlovas Aksamitauskas. Chemosphere. Volume 151, May 2016, Pages 124-132. Phosphorus and cadmium availability in soil fertilized with biosolids and ashes - ScienceDirect

Basic Information about Biosolids. U.S. EPA. Basic Information about Biosolids | US EPA

Land Application of Biosolids. U.S. EPA. Land Application of Biosolids | US EPA

Hydromantis, Inc. (2010). "Emerging substances of concern in biosolids: concentrations and effects of treatment processes" (PDF). Canadian Council of Ministers of the Environment. 2018. Wayback Machine (archive.org)

Biosolids. Wikipedia. Biosolids - Wikipedia

Biosolids Technology Fact Sheet: Land Application of Biosolids. U.S. EPA. Biosolids Technology Fact Sheet: Land Application of Biosolids (epa.gov)

Biosolids Technology Fact Sheet: Use of Incineration for Biosolids Management. U.S. EPA. P:\WTC-Studies\EPA Contract\04 Fact Sheets\Option Year 2 - 742092\Deliverables-Final\FINAL_Incineration for Biosolids 2.wpd        

Russia and the Kremlin Are Nearly Everywhere There is Conflict, Nearly Always with the Bad Guys.


     Wherever there is conflict in the world it seems as if Russia is involved in instigating it. From meddling to help Maduro after the recent faked Venezuelan election results, to arming Libyan rebels, to helping the brutal RSF (formerly the Jangaweed) in Sudan, to propping up the brutal Syrian regime, to meddling in Georgia, Moldova, and elsewhere, to their own fake elections, to mercenaries in Africa meddling in local skirmishes and mining projects, to strong military cooperation with pariah countries like Iran and North Korea, to assassinations of dissidents, to routine jailing of foreign nationals and trading them for murderers and terrorists, to jailing and torturing opposition leaders, to suppression of human rights, to conscription in a brutal war using ‘meat grinder’ tactics, to a vast multitude of war crimes in Ukraine and Syria including 4000 reported occurrences of chemical weapons use in Ukraine, to routinely weaponizing oil and gas and manipulating markets, to routinely meddling in elections, to frequent nuclear threats, to routine sanctions-evading tactics, to so so much more. The list is very long. Wherever there is brutality and unfairness in the world it seems the government of Russia is there helping along the brutality and unfairness.

     Russia also has a very widespread propaganda machine with a long reach. Socialists in Latin America, communists in Vietnam, China, and North Korea, socialists in Europe and even in America, fellow authoritarians, and other nefarious and deluded groups participate in spreading what are in many cases insidious lies and bad arguments. Other countries like India participate as well. Russia has exploited African discontent with past colonialist errors to gain influence and make countries more suspicious of Western governments. Those on the extreme political right and the extreme political left are most likely to be aligned with Russia

     The husband of recently freed Russian-American journalist Alsu Kurmasheva noted that Russia does not place a high value on human life. We can see that distinctly as the Kremlin sends young men to slaughter in Ukraine and mistreats them in other ways. In turn, the Russian army mistreats and tortures prisoners and is brutal on recruits as well. 

     From Russia’s perspective, there are friendly countries and unfriendly countries. Some of the friendly countries are strongly supportive. All from that camp are oppressive and rogue countries: Syria, Iran, Cuba, Venezuela, Nicaragua, North Korea, Belarus, and occasionally China. Then there are the friendly countries that are trying to be neutral like India, UAE, South Africa, and also China. Russia, China, Iran, North Korea, and India – all friendly to Russia, lead the world in cybercrime.

     Before Putin decided to full-scale invade Ukraine, he had it made. Russia was selling record amounts of oil and gas to Europe with continued profit in the years ahead looking likely. The sanctions after the first invasion that took Crimea and parts of the Donbas in 2014, were light and easily endured. In 2021-2022 a false narrative was concocted about Ukrainian Nazis mistreating Russian-speaking Ukrainians in the Donbas. It was untrue but played well in Russia and support for the invasion was kept up. We don’t hear much about the Ukrainian Nazis these days, although maybe an occasional reference.

     Anyway, this post is about how Russian geopolitical projects are not helping the world but harming it. It is simply hard to deny. The perennial ‘bad boy’ Putin did have it made. He was well tolerated even respected, before he invaded Ukraine. He did not deserve to be tolerated nor respected. He was never a good guy. There are, however, good guys in Russia, or in some cases, no longer in Russia. I was happy when Kara-Murza was set free. He is a courageous, smart, sensible, and compassionate guy. Navalny was a stalwart of courage. These guys and many others are the real Russian heroes. As this post suggests, a free and democratic Russia would be a great boon for the world. Will it ever happen? It is hard to say. Kara-Murza thinks it will but that it will take time.

     Just think, a free and democratic Russia. That alone would instantly solve many world problems. It would make Islamic extremism again the number one bane, one that Russian menacing seems to have overtaken. But both are forms of authoritarianism, one military-political and the other religious, neither useful for humanity.

     To top it off Russia wants to create a worldview that competes with the so-called ‘rules-based Western order.’ Their worldview is not based on following rules, but rather on some sort of might-makes-right threat-based order. I will say the bottom line loudly: No Brutality! No Cheaters! F%#k Russia and F&%k the Kremlin! For the good of the world, let them fail and fall! 


Addendum: September 16, 2024.

Russia Using Ukrainian Farmland to Fuel a Global Black Market.

     A new report from Straight Arro News says that Russia has been selling stolen Ukrainian grain on the black market to Iran, Syria, and the UAE. The grain is rerouted through Russia to disguise its origin. It is another sanctions evasion maneuver. Russia basically took over business operations in occupied Ukraine, making a once legitimate industry illegitimate. People also should have the right to know from where they are getting their products. There is also evidence that the profits are supporting Russia’s war effort. 


References:


Russia is using Ukraine's farmland to fuel a global black market: Report. Straight Arrow News. September 16, 2024. Russia is using Ukraine's farmland to fuel a global black market: Report | Watch (msn.com)

Australia: Land of Uranium (and Thorium) Reserves: And Significant New Discovery at Edge of Cooper Basin, South Australia During a Uranium Bull Market


     Radioactive ores were first produced in Australia in 1906. As the graphs below show, 2000-2015 was the peak of Australian uranium production. Australia is by far the first in the world in terms of uranium reserves. The map below shows the mines and deposits.


     Oddly perhaps, Australia has no nuclear power plants. Anti-nuclear sentiment has been prevalent in the country in the past, even affecting uranium mines. There was a ban on uranium mining in Western Australia that was removed in 2008 by the Howard administration. A ban on Queensland uranium mining was removed in 2012 but reinstated in 2015. A ban was lifted in 2012 in New South Wales as well. Opposition against uranium mining was led by the Australian Labor Party (ALP). Virtually all Australian uranium is exported.

     In January 2021 Australia closed its largest uranium mine, the Ranger Mine, after 40 years of production. While Australia has by far the largest uranium reserves, in 2021 it was the fourth largest producer of uranium after Kazakhstan, Namibia and Canada. Now, only two uranium mines are producing in Australia: Olympic Dam and Four Mile, both in South Australia. The closing of the Ranger mine is expected to result in a medium-term 20% drop in Australian uranium production. Some historical trends in production are shown below.


Australia is Rich in Thorium Too

     As the graph below shows, Australia is tied with the U.S. as the world’s third richest country in thorium reserves. While thorium has been used in the past as a nuclear fuel, there are currently no reactors using it and thus there is no current market for thorium. There is no current production of thorium in Australia, and it is thought that there won’t be production in the future either. Reserves and locations of undeveloped thorium in Australia are shown below.


Big Lake Project on the Edge of the Cooper Basin

     With only two operating mines, the search for the most economical to mine resources was on. There has not been a significant greenfield discovery of high-grade uranium ore since 2007 when the Samphire Uranium Project was developed. That has changed with recent drill tests indicating medium-grade uranium ore in South Australia on the edge of the Cooper Basin by Alligator Energy. While the ore quality is not as high as that of the Samphire project, it is a thicker accumulation. Drilling began in May 2024. The drill hole results are shown below:


・Hole AC24-021 — 20 metres at 110 parts per million (ppm) uranium from 106 metres, including 1 metre at 241 ppm uranium from 123 metres

・Hole AC24-021 — 1 metre at 185 ppm uranium from 129 metres

・Hole AC24-022 — 5 metres at 130 ppm uranium from 107 metres

・Hole AC24-023 — 5 metres at 45 ppm uranium from 104 metres

・Hole AC24-025 —10 metres at 120 ppm uranium from 180 metres


The ore is hosted in paleochannel sand units. More initial and follow-up drilling is in progress and planned. Uranium-bearing fluids migrate upward along fault planes from there Big Lake granite suite that serves as the uranium source rock. They collect in tabular bodies in the paleochannel sands. Some of the geological information is shown below.


The Current Uranium Bull Market

     One reason the Alligator Energy discovery could be profitable is that uranium is currently selling at premium rates, As the graph below shows, this bull market is significant. There has not been such a peak in prices since around 2007. As the graph states, uranium does not sell in an open market like other commodities, but contracts are negotiated privately. The bullish trend began about eight years ago but has increased much since 2022.


References:


Alligator Energy Makes Uranium Discovery During First Drill Program at Big Lake Project. Gabrielle De La Cruz. Investing News Network. August 14, 2024. Alligator Energy Makes Uranium Discovery During First Drill Program at Big Lake Project (msn.com)

Significant New Uranium Discovery at Big Lake Uranium Project, South Australia. Alligator Energy. August 13, 2024. 2924-02838091-2A1540662&v=fc9bdb61fe50ea61f8225e24ce041a0e155a9400 (markitdigital.com)

List of countries by uranium reserves. Wikipedia. List of countries by uranium reserves - Wikipedia

Uranium mining in Australia. Wikipedia. Uranium mining in Australia - Wikipedia

Uranium and Thorium. Australian Government. Geoscience Australia. Uranium and Thorium | Australia’s Energy Commodity Resources 2023 (ga.gov.au)

List of countries by thorium resources. Wikipedia. List of countries by thorium resources - Wikipedia

Will the Bull Market in Uranium Continue? Andrew Hecht. Bar Chart. August 16, 2024. Will the Bull Market in Uranium Continue? (msn.com)

Wednesday, August 28, 2024

New Zealand’s Natural Gas Dilemma: LNG Imports and New Exploratory Drilling Expected


     Following continued declining natural gas production and a 2018 ban on offshore drilling, New Zealand is moving back towards natural gas. Both new drilling and LNG imports are expected to occur as the 2018 ban is lifted and LNG has been given consent by the center-right government. Reuters reports that according to New Zealand’s energy minister “natural gas production fell by 12.5% in 2023 and a further 27.8% in the first three months of 2024, triggering a nationwide energy shortage as generators switched to more coal and diesel to power the grid.”


The Taranaki Basin: Main Source of New Zealand Natural Gas and Oil

     The Taranaki Basin is a Cretaceous rift basin on the West Coast of New Zealand that extends both onshore and offshore. Extensional stresses during the breakup of Gondwanaland led to the rifting. Production from the basin makes up the majority of New Zealand’s hydrocarbons. 70% of the production is natural gas. The total reserves discovered are about 1.8 billion barrels of oil equivalent (BOE). Around 400 wells have been drilled in about 20 fields. Due to the complex history of the basin, there are several different kinds of plays and traps, mostly structural. Cretaceous marine shales and coals are the source rocks. The multitude of play and trap types and the small number of wells drilled suggest that there are more hydrocarbons to be found in the basin. Structural play types include thrust fault traps, inversion structures, extensional structures, half-graben fills, stratovolcano flank traps, submarine fans, and diagenetically altered sandstones. The variability in play types, trap types, and rock mechanics means that each field may be much different. As can be seen on the maps the fields tend to be small and discontinuous.


     A 1997 article by Richard Cook and Roger Gregg in the Oil & Gas Journal describes the geologic setting in terms of tectonics and stratigraphy for the Taranaki Basin:

1. Late Cretaceous to Paleocene intra-continental rift transform, characterized by nonmarine sedimentation in restricted, fault-controlled basins. These sediments include important coal measure source rocks.

2. Eocene to Early Oligocene passive margin, associated with post-rift thermal contraction and regional subsidence. Basinwide sedimentation patterns were characterized by comparative tectonic quiescence, peneplanation, and marine transgression. Coal measures and well developed sandstones in the marginal marine setting contain proven source and reservoir rocks.

3. Oligocene to Recent pericratonic basin, straddling the outer limit of broad-scale deformation associated with the evolution of the Australia-Pacific convergent plate boundary through New Zealand. Throughout the Neogene, the basin has been part of the Australian Plate, and evolved with two tectonic settings: active margin (Eastern mobile belt) and passive margin (Western stable platform).


Maui Offshore Gas Field: Once the Biggest Field, It is Now Depleted

     The offshore Maui gas field offshore of the North Island in the Taranaki Basin began full production in 1979. Two platforms were operated. By 2005 it was considered over 90% depleted and production has dropped off considerably as seen below. However, in 2014, reserves for the field were recalculated, suggesting there is more gas to be produced. By a wide margin, the Maui field had the highest ultimately recoverable reserves of both oil and gas. However, its remaining reserves are now thought to be much smaller than most other fields. In an exploration sense, finding another Maui field or two in the Taranaki Basin area would be a solution to the dilemma.


Gas Production Decline

     New Zealand’s natural gas production is expected to drop below demand very soon. It is expected to be about 10 petajoules (PJ) below the total demand of about 150 PJ for the next three years. Usable gas reserves for the country are estimated at just 8.7 years. New Zealand mainly relies on hydro (~60%), geothermal (~15%), and natural gas (~9%) for electricity. Wind and solar are minor sources but are growing. Natural gas is also used in industry, particularly the chemical industry. The gas shortage is already affecting some industrial users. Most of the drop in estimated reserves is due to use through time but over half is due to a recent re-evaluation by field operators who adjusted reserves downward by about 185 PJ or about 1.25 of usable reserves. In any case, this is quite concerning for anyone depending on natural gas. It is an unsustainable situation. The Ministry of Business, Innovation, and Employment reports:

Of all the gas used in New Zealand in 2023, the majority was used by the industrial sector, either being burned for heat (35% of all use) or being used as a feedstock (26%) in factories. Around 29% of gas use was for electricity generation, and the remaining 10% of use represented use by households, schools, hospitals, and other businesses.”


New Zealand’s Primary Energy Use by Source and Electricity Mix

     Below are some graphs showing New Zealand’s primary energy use by source and its electricity mix by source. These are from the New Zealand government, Our World in Data, and Energy Institute's Statistical Review of World Energy. 


The 2018 Offshore Ban and Its 2024 Lifting: Will Companies Drill?

     Jacinda Ahern’s left-leaning government enacted a ban on offshore drilling in 2018. Companies have been increasing spending and drilling development wells in New Zealand, but the new wells have not performed well. It was originally hoped that the weather-based renewables: solar, wind, and especially hydro, would make up any shortfalls in the power sector, but that has not happened. Hydro has been impacted by low water levels. Solar and wind have been underperforming as well. Electricity prices have risen due to the gas shortage.

     Now in 2024, the cabinet of the government has agreed on some changes including lifting the 2018 ban and giving consent to build a new LNG import facility, which would be the first in the country. Perhaps, if they had continued exploration and drilling at pre-ban levels, they could have staved off the need to import LNG. Importing LNG is significantly more carbon intensive than producing domestic gas and pipelining it to where it is needed. It is yet another case in which environmentalism and climate change-influenced policies will likely lead to more emissions than if the policy was never enacted. Fast-tracking permits are also on the table, not only for natural gas development and the LNG terminals but also for renewables permitting and development.

     Since most of New Zealand’s gas has come from offshore, the ban was immediately impactful. Not only was exploration banned by development drilling to extend fields was too. The ban did exclude a part of the area off of the west coast of the North Island in Taranaki. The ban reversal was strongly condemned by environmental groups and the country’s Green Party. In the past, climate activists and Greenpeace have targeted offshore drilling in New Zealand. 

As noted, new exploration and spending on new wells failed to increase supply in recent years. Below is an analysis of cost and supply increases from 2016-2020 and 202-2024 showing the particularly poor results in the past four years. Significantly more gas was found at less than 30% of the cost in 2016-2020 compared to 2020-2024. 


An Exploration Opportunity?


     The previous ban suggests that if a left-leaning government returns to power, the ban could be re-enacted, leaving explorers stranded in monetizing the resources in which they have invested. This creates regulatory uncertainty. However, with a clear gas shortage that is affecting gas prices and electricity prices, there is a clear need to increase natural gas supply.

      These types of structural plays require significant exploratory spending with extensive seismic surveying and geologic modeling. Building new drilling and production platforms is also time-intensive. Thus, exploring for, drilling, and producing new wells is likely to take longer than building a new LNG import facility, which could be built adjacent to an existing offshore platform.

     It remains to be seen if and when exploratory drilling will increase as a result of the ban being lifted, but it is likely to happen.


References:


Govt to automatically consent natural gas import facility. Marc Daalder. Newsroom. August 26, 2024. Govt to automatically consent natural gas import facility - Newsroom

NZ is running out of gas – literally. That’s good for the climate, but it’s bad news for the economy. David Dempsey, Jannik Haas, and Rebecca Peer. The Conversation. August 12, 2024. NZ is running out of gas – literally. That’s good for the climate, but it’s bad news for the economy (theconversation.com)

Oil and gas industry in New Zealand. Wikipedia. Oil and gas industry in New Zealand - Wikipedia

Gas Statistics. New Zealand Ministry of Business, Innovation, and Employment. Gas statistics | Ministry of Business, Innovation & Employment (mbie.govt.nz)

Petroleum in New Zealand. New Zealand Petroleum and Minerals. Petroleum in New Zealand - New Zealand Petroleum and Minerals (nzpam.govt.nz)

New Zealand to Reverse Oil and Gas Exploration Ban, Ease LNG Import Rules. Pipeline & Gas Journal. August 26, 2024. New Zealand to Reverse Oil and Gas Exploration Ban, Ease LNG Import Rules | Pipeline and Gas Journal (pgjonline.com)

From wellhead to burner - The New Zealand Gas Story, Gas Industry Company Limited. August 2014. https://www.gasindustry.co.nz/assets/DMSDocumentsOld/speeches/4488nz-gas-story-presentation-wellington-7-august-2014.pdf

Our Energy Mix. Energy Resources.org. Our Energy Mix | Energy Resources Aotearoa

The Importance of Oil and Gas to New Zealand. Energy Resources.org. The Importance of Oil & Gas to the New Zealand Economy (energyresources.org.nz)

New Zealand: Energy Country Profile. Hannah Ritchie and Max Roser. Our World in Data. New Zealand: Energy Country Profile - Our World in Data

Overview of New Zealand's petroleum systems, potential. Oil & Gas Journal. January 6, 1997. Overview of New Zealand's petroleum systems, potential | Oil & Gas Journal (ogj.com)

Geology of New Zealand. Wikipedia. Geology of New Zealand - Wikipedia

Taranaki Basin. Wikipedia. Taranaki Basin - Wikipedia

Maui gas field. Wikipedia. Maui gas field - Wikipedia

Gas production forecast to fall below demand. New Zealand Ministry of Business, Innovation, and Employment. July 11, 2024. Gas production forecast to fall below demand | Ministry of Business, Innovation & Employment (mbie.govt.nz)

Electricity sector in New Zealand. Wikipedia. Electricity sector in New Zealand - Wikipedia

New Zealand Petroleum Basins. New Zealand Petroleum and Minerals. Part 1. New Zealand's Petroleum Basins - Part One (nzpam.govt.nz)

New Zealand Petroleum Basins. New Zealand Petroleum and Minerals. Part 2. New Zealand's Petroleum Basins - Part Two (nzpam.govt.nz)

Bill to resume oil and gas exploration set for later this year. RNZ. June 9, 2024. Bill to resume oil and gas exploration set for later this year | RNZ News

The end of offshore oil and gas exploration in NZ was hard won – but it remains politically fragile. The Conversation. May 8, 2023. The end of offshore oil and gas exploration in NZ was hard won – but it remains politically fragile (theconversation.com)

      Highly regarded energy analyst Javier Blas recently wrote in Bloomberg about the risks of electrification. The call among climate acti...

Index of Posts (Linked)