When it comes to
carbon intensity, not all U.S. basins are equal. There are several reasons for
this. Dry gas plays are easier to mitigate for methane since methane dissolved
in oil and condensate does not need to be considered. Gas flaring is confined
mainly to oil plays. The 2021 graph below from Rystad shows the variation in
carbon intensity among U.S. shale oil & gas basins. I added the indicators
to the graph.

US Basins: Upstream Scope 1 CO2 emissions intensity. Adapted from Rystad (2021)
Platts, a part
of S&P Global Commodity Insights recently announced a launch of monthly
carbon intensity measurements for eight market locations in the U.S. These will
serve as a measure for what would probably be considered to be a voluntary
carbon market since it includes “associated carbon-accounted price
assessments.” This effort is another in a series of emissions benchmarking
protocols across the industry. Kevin Birn, Global Head of Center of Emissions
Excellence, S&P Global Commodity Insights, said: "We're excited to
be offering our clients and the marketplace this truly unique assembly of
carbon intensity insight that brings transparency to carbon across the value
chain of natural gas -- from upstream production, gathering and boosting, and
gas processing, to transport and amalgamation into market hubs. Not only is the
offering unparalleled in detail and complexity, but it enables and facilitates
the benchmarking of carbon and aids its incorporation into asset and commodity
valuations."
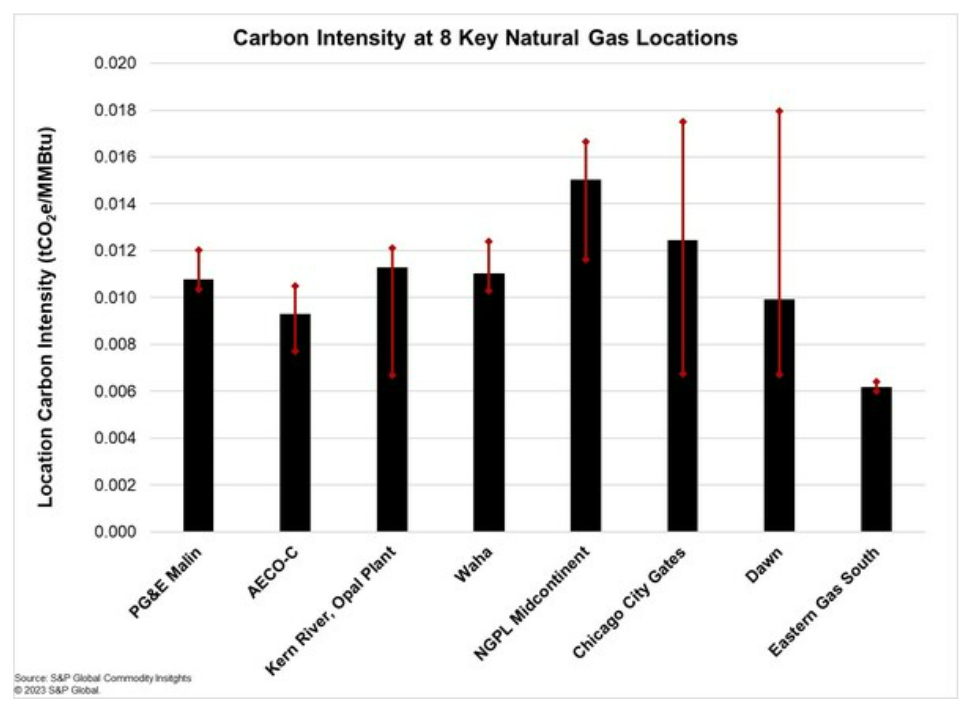
The different
market hubs can be seen in the graph below. They represent blends from multiple
basins but still reflect the main basin of origin in some cases. For instance, the
low emissions intensity of Eastern Gas South reflects the low emissions
intensity of the Marcellus and Utica regions which are mainly dry gas plays.
S&P Global notes: “Lowest carbon-intensity locations are those with
shorter transport distances from basin to hub, less processing requirements
(i.e., dry sweet gas) and lower methane emissions throughout the supply chain.”
They also note that emissions intensity will vary over time and can vary dramatically
by company. They will also publish “a
daily associated carbon-accounted natural gas price assessment for each
location, expressed in US dollars per MMBtu, and using the Platts Carbon
Removal Credit Assessment (Platts CRC).” These efforts will bring and keep emissions
intensity into clear focus.
In the U.S. an
EPA fine on methane emissions is expected to go into effect in 2024 at $900 per
metric ton emitted, increasing to $1200 per metric ton in 2025, and $1500 per
metric ton in 2026.

Measurement, reporting, monitoring, and verification
efforts have been undertaken for a few years now as part of the responsible gas
or certified gas protocols. This can be difficult due to the variability of
sources and rates of methane leakage from upstream to downstream in the
industry. Leaks can also be intermittent. Gas Technology Institute’s Veritas
protocol is developing industry standards for comparable measurement. Verification
is by direct field measurements, many with continuous monitoring. Certification
is mainly through the MiQ certification standard that has been widely adopted.
Methane emissions are also double-checked with independent third-party
satellite data from government agencies and environmental groups like the Environmental
Defense Fund (EDF), which has launched satellites to measure methane emissions globally
with good resolution.
Meanwhile, the
E.U. has just reached an agreement to reduce methane emissions from the oil
& gas and coal sectors within the E.U. This requires companies to “properly
measure, monitor, report and verify their methane emissions according to the
highest monitoring standards, and take action to reduce them”. The same
requirements for imports are expected to go into effect in 2027. This does not
bode well for countries like Russia. While Russia’s pipeline-imported gas
volumes to the E.U. are now very low, their LNG exports to the E.U. have risen
by significant amounts. Russia is known to have high methane emissions and is
not expected to be a fair player in emissions reductions. Since LNG has a significantly
higher carbon intensity than pipelined gas, this has resulted in emissions
rising in the E.U. due to the increase in LNG imports to Europe from the U.S.,
Russia, and elsewhere. Previously stated goals are to reduce methane emissions
globally by 30% by 2030. This is likely achievable, at least among responsible countries.
One issue that could cause problems is aging infrastructure which is more prone
to leaking. Countries such as Russia, Ukraine, Turkmenistan, and Azerbaijan have
this problem. That makes it more expensive for them to come into compliance. EDF’s
European division estimated that the E.U.’s LNG carbon footprint is about 8
times higher than its domestic footprint.
Thus, one can
see that the Russian invasion of Ukraine disrupted European decarbonization plans
in many ways: increase of LNG/reduction of pipelined gas, the blowing up of the
Nordstream gas pipeline which resulted in significant releases of methane directly
into the atmosphere, and the higher costs of energy which took away spending
that could have been applied to decarbonization efforts, and exacerbated inflation.
References:
A gas boom is coming in the US, a closer look at
Haynesville and Appalachia reveals records and a risk. Rystad Energy. April 22,
2021. Rystad
Energy - A gas boom is coming in the US; a closer look at Haynesville and
Appalachia reveals records and a risk
S&P Global Commodity Insights Launches Carbon Intensity Measures & Carbon-Accounted Price Assessments for North America Natural Gas Markets. S& P Global. November 15, 2023. S&P Global Commodity Insights Launches Carbon Intensity Measures & Carbon-Accounted Price Assessments for North America Natural Gas Markets | S&P Global Commodity Insights (spglobal.com)
EPA’s
Methane Rulemaking Timeline. Harvard Environmental & Energy Law Program.
July 13, 2023. EPA’s
Methane Rulemaking Timeline - Harvard Law School
How to
Cut Methane Emissions from Global Gas. Ben Cahill & Arvind Ravikumar.
Center for Strategic and International Studies. November 14, 2023. How
to Cut Methane Emissions from Global Gas (csis.org)
Oil
and gas industry jittery as EU nears deal on methane leakage. Nikolaus J.
Kurmayer. Euractiv.com. November 13, 2023. Oil and gas industry jittery as EU
nears deal on methane leakage – EURACTIV.com
EU
reaches deal to reduce methane gas emissions from energy sector. AP. The Irish
News. November 15, 2023. EU
reaches deal to reduce methane gas emissions from energy sector (msn.com)
GTI
Energy's Methane Emissions Measurement and Verification Initiative. Gas Technology
Institute. Veritas:
GTI Energy's Methane Emissions Measurement and Verification Initiative • GTI
Energy

No comments:
Post a Comment