The annual EPA Air
Quality National Summary includes air quality trends, emissions trends, and weather
influence. The data clearly shows improvements in nearly all ambient air
pollutants in the most recent trend from 2010-2023. EPA notes:
“These estimates are based on actual monitored readings
or engineering calculations of the amounts and types of pollutants emitted by
vehicles, factories, and other sources. Emission estimates are based on many
factors, including levels of industrial activity, technological developments,
fuel consumption, vehicle miles traveled, and other activities that cause air
pollution.”
Input from state and local air quality agencies, tribes, and
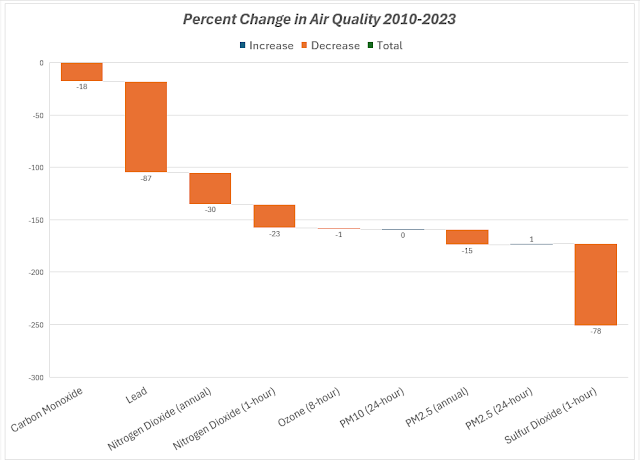
industry is used to get the data. Percent changes in air quality are shown
below. I made two graphs from the data to show the same information graphically,
one for 2010-2023 and one for 2000-2023.
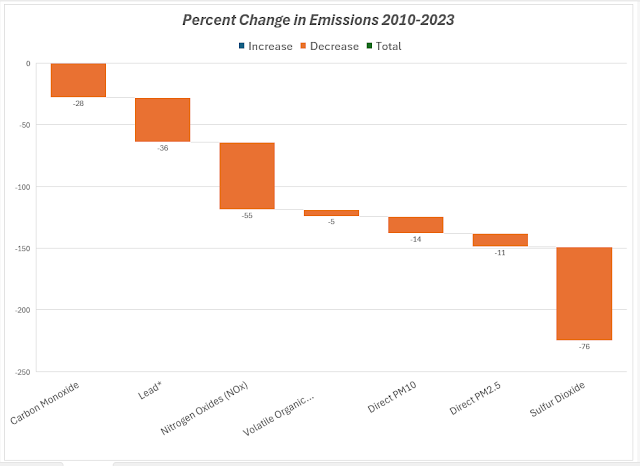
The next table shows the percent changes in emissions. Similarly, I made two graphs from the data, one for 2010-2023 and the other for 2000-2023. The emissions data shows changes in VOC emissions as well as the six criteria pollutants.
“Emissions of air pollutants continue to play an
important role in a number of air quality issues. In 2023, about 66 million
tons of pollution were emitted into the atmosphere in the United States. These
emissions mostly contribute to the formation of ozone and particles, the
deposition of acids, and visibility impairment.”
The graph below
shows some interesting, important, and optimistic trends. It is clear that the aggregate
emissions from the six criteria pollutants (lead, carbon monoxide, nitrogen
oxides, sulfur dioxide, PM 2.5, and ozone) have thoroughly decoupled from GDP, vehicle
miles traveled, and population. Energy consumption and CO2 emissions have also
decoupled from GDP, vehicle miles traveled, and population, but not as much as the
air pollutants. There are several reasons for the reductions in air pollutants
including the retiring of more coal-fired power plants which reduced sulfur
dioxide, PM, and NOx, and some of the other criteria pollutants. This increase
in the retiring of these plants was made possible in large part due to the wide
low-cost availability of less-emitting natural gas to replace coal. That
availability was enabled by advances in the upstream oil & gas industry
such as high-volume hydraulic fracturing, horizontal drilling, and other
associated technological and efficiency improvements in the industry. Tighter
regulations also contributed to the decrease. It is a success story that
should be told more often.
The final graph
below shows that there is still more work to be done to decrease air pollution
since millions of people still live where air pollutants are present at high
levels, particularly ozone and particulate matter.
Finally, the EPA
notes that the weather has a strong influence, particularly on the ozone and
particulate matter that make up most of the air pollution problems faced today.
“Weather conditions influence emissions and air
quality. EPA has developed statistical
approaches to account for weather’s influence on ozone and fine particles. While these approaches do not change the
quality of air we breathe, they do help us understand how well emission
reduction programs are working.”
References:
Air
Quality – National Summary. U.S. EPA. 2024. Air Quality
- National Summary | US EPA


No comments:
Post a Comment