Monday, October 7, 2024

ExxonMobil Global Outlook: Our View to 2050: Review & Summary


     The first statement in this short outlook report is this:

In 2050, the world will be different - vastly different.”

     They first note that energy access is a very real problem for many in the world and that global population and energy demand will continue to increase. They assert that 4 billion people. Basically, half of the world’s population lives “below the modern energy minimum.” They define ‘modern energy minimum’ as a per capita energy use of at least 50 million British thermal units (MMBtu) per year. Modern developed countries typically have a per capita energy use of three times that or more. Extreme poverty, lack of energy access, and lack of access to clean cooking fuels are three of the most pressing problems.


     ExxonMobil estimates that getting the unenergized world up to the energy minimum standards will require a 25% increase in energy use in those countries by 2050. This, combined, with a projected 10% decrease in energy use in developed countries would result in a net energy use increase of 15%. They also think that as energy efficiency continues to improve, as more renewables are deployed, and as CO2 abatement technologies like CCS ramp up, that global carbon emissions will begin to fall in 2030 and fall by 25% by 2050. That is less than the Paris Accord calls for but it is probably more realistic at this point.


     Their forecast for the global energy mix to 2050 suggests that oil and gas use will actually increase a little bit in BTU terms (but will decrease as a percentage from 56% to 54%) as coal use decreases from 24% to 13% of the global energy mix. They also predict that global solar and wind will increase by four times from 3% in 2023 to 12% in 2050. The graphic below compares ExxonMobil's scenario to some IEA and IPCC scenarios.


     They note that while oil & gas demand for transport via light-duty vehicles will decrease by 2050 its use in commercial transport (trucking, shipping, aviation) and in industry (chemicals and manufacturing) is predicted to increase. While wind and solar can power electricity they cannot power heavy industry and heavy transport, expected to make up 50% of energy requirements in 2050, in any viable way in the near term. Biofuels, hydrogen, and CCS will help but still will be limited in impact.


     They note that their analysis differs considerably from many net-zero by 2050 analyses such as the one by the IEA in that it does not set a target and work back to figure out how to get there. Instead, it considers all the factors such as likelihood of certain policies, costs, technological maturity, and the public’s ‘willingness to pay’ for faster decarbonization. Thus, theirs is a projection rather a scenario to get to a certain goal as the IEA and IPCC scenarios are. 


     They note that their analysis sees a strong need for continued oil and gas investment. Their numbers suggest that oil production is declining at a rate of about 15% per year, which is almost double the IEA decline rate projections of 8% per year. The development of unconventional assets, mainly shale and other ‘tight’ or low permeability reservoirs, results in higher initial decline rates. Thus, they conclude that no new investment to 2030, for example, would result in more than a two-thirds decrease in oil supply from 100 million barrels now to less than 30 million barrels in 2030. That would result in severe energy shortages and soaring costs. There really is no viable alternative, despite what the climate activists say. Thus, they conclude that any ‘keep it in the ground” strategy would not only be unfeasible but also unjust.


CEO Darren Woods commented:


To get serious, three things are needed: supportive public policy, significant technology advancements, and a smooth transition from government subsidies to market-based mechanisms.”


     Biofuels, CCS, hydrogen, and the new technologies will no doubt increase and ramp up in the years ahead and scale up in the 2030s, but their impacts won’t be major for decades for a few simple reasons: cost, need for subsidization, and technological limitations.


     Finally, they list five key takeaways of the outlook:


1. All energy types will remain in the mix.

2. Renewables will grow the fastest.

3. Coal will decline the most.

4. Under any credible scenario, oil and natural gas remain essential.

5. Lower-carbon technology needs policy support to grow rapidly but ultimately must be supported by market forces.


References:


ExxonMobil Global Outlook. Executive Summary. Our View to 2050. August 2024. 2024 ExxonMobil Global Outlook Executive Summary

Saturday, October 5, 2024

Putin Threatens to Limit Supply of Enriched Uranium, Titanium, and Nickel


     In September 2024 Russian dictator Vladimir Putin told his government to explore restrictions on important raw materials and metals:

"Many goods shipments to us will be limited, and perhaps we should also consider some restrictions, such as regarding uranium, titanium, and nickel."


Enriched Uranium

     Over the past two and a half years since Russia invaded Ukraine, Western countries and some allies have resourced oil, gas, petroleum distillates, coal, and minerals in order to reduce their dependence on Russia for these materials. However, some needs remain, especially where it is expensive, technically challenging, and time-consuming to develop new sources. This is especially the case with enriched uranium. Russia’s Rosatom still supplies 40% of the global market for high-quality low-enriched uranium for nuclear power plants, including 20% of the U.S. needs and 30% of the E.U. needs. Rosatom generated $4 billion in revenue from the U.S. and E.U. in 2023, about 25% of its revenue. That is down from before, but it is still clear that there is considerable global dependence on Rosatom as a supplier. Of course, limiting that supply would be painful for both seller and buyers but it is probably the biggest materials leverage Putin still retains. Two European companies, Urenco and Orano, also enrich uranium and are expanding their operations. The U.S. restarted uranium enrichment through the American company Centrus Energy late in 2023, but that operation is still very small. Estimates are that the U.S. could go without Russian-enriched uranium for about five years and the E.U. a little bit longer. Recently, the U.S. imported more enriched uranium from China, but it is thought to be Russian uranium resold.

     In 2023 there were 30 countries generating nuclear energy in some 440 plants importing uranium and other radioactive materials from Rosatom. Rosatom also provides nuclear services to those plants. They noted in 2023 that they are currently building 33 new reactors in 10 countries. Dependence on Russia for enriched uranium allows them to fund the maintenance of their own nuclear arsenal as well as their military buildup and the Ukraine war machine that has become the driver of their economy. According to a 2023 AP article:


Rosatom CEO Alexei Likhachyov told the Russian newspaper Izvestia the company's foreign business should total $200 billion over the next decade. That lucrative civilian business provides critical funds for Rosatom's other major responsibility: designing and producing Russia's atomic arsenal, experts say.”


     Ukraine has urged the West to sanction Rosatom. Either way, sanctions or limiting supply would be financially painful for both sides.  

     The U.S. purchases the bulk of its enriched uranium, 35%, from Kazakhstan, a Russian ally but also friendly to the U.S. Kazakhstan is the world's largest producer of enriched uranium. Russian-designed reactors are most dependent on Rosatom’s enriched uranium. There are 19 such reactors in Europe. Before the war, France had recently tripled its purchase of Russian-enriched uranium. Sweden dropped Russian-supplied enriched uranium and Finland scrapped plans to build a nuclear power plant with Rosatom.


 “Based on apparent prospects [of diversification of fuel supplies], it would be fair to say that Rosatom has lost the European market,” said Vladimir Slivyak, co-chair of the Russian environmental group Ecodefense.


     In May 2024 the Biden-Harris administration with bipartisan support banned uranium imported from Russia with some exceptions – if a company can show that there is no other source available it can be exempted. The law went into effect in August. By the end of 2027, the exceptions will expire. The U.S. is partnering with Canada, France, the U.K., and Japan to develop a global non-Russian supply of enriched uranium but that will take time.

     The ban “prohibits any imported unirradiated low-enriched uranium (LEU) produced in the Russian Federation or by a Russian entity.” The DOE noted:


Under the HALEU Availability Program, we’re working on various activities to secure a domestic supply of HALEU — an important material needed to develop and deploy advanced reactors.”


Our Piketon demonstration project already produced the nation’s first amounts of HALEU for next-generation reactors, with plans to increase production to 900 kilograms in the near future. We’re also looking to award contracts this year for HALEU enrichment and deconversion services.”


Internationally, we’re collaborating with our Sapporo 5 — a strategic partnership between the United States, United Kingdom, Canada, France, and Japan — to support the stable supply of fuels for existing, operating reactors and to enable the development and deployment of fuels for future advanced reactors.” 


Source: U.S. Dept. of Energy


Titanium


     Russia also exports titanium sponge through its company VSMPO-Avisma to American, Canadian, and European companies. The E.U. imports around $350 million of Russian titanium, dropping by about 10% over 2022. The U.S. has companies that process titanium sponge but the E.U. does not. Thus, the U.S. is less dependent on Russian titanium than the E.U. The E.U. is becoming more dependent on the U.S. for titanium.


Nickel

     Russian company Norilsk Nickel is one of the world’s largest nickel producers. Just a month ago in August 2024, the U.S. imposed sanctions on Russian nickel but the E.U. has yet to do so. Before the war the E.U. was the source of 50% of Norilsk Nickel revenue and that no has dropped to about 24%. The North and South American share of the revenue has dropped from 16% to 10%. Nickel demand has increased in recent years due to its use in lithium-ion batteries for EVs. Luckily, a new large source of nickel from Indonesia is in operation and is keeping prices down for the in-demand metal. China is heavily invested in Indonesian nickel. Indonesian nickel is reducing Russia’s nickel leverage.

     Putin has leveraged gas, oil, and other minerals and commodities in the past and may do so now with enriched uranium, titanium, and nickel. Enriched uranium is the main potential problem in terms of value. However, any limitations will hurt Russia as well. He may want to cause the price to rise through his threats. It is unclear what will happen, but one thing is clear: Putin does not hold nearly as much leverage to threaten as he did before the Ukraine invasion. We will not go back to dependence on a totalitarian Russian government for materials. Efforts to wean off that dependence will continue and hopefully succeed quickly.


References:


Putin threatens raw material supply amid Western sanctions. Katarzyna BogdaƄska. Conflict Watcher. October 4, 2024. Putin threatens raw material supply amid Western sanctions (msn.com)

Putin Profits Off US, European Reliance on Russian Nuclear Fuel. Associated Press. August 13, 2023. Putin Profits Off US, European Reliance on Russian Nuclear Fuel (voanews.com)

Biden-Harris Administration Enacts Law Banning Importation of Russian Uranium. U.S. Dept. of Energy. May 14, 2024. Biden-Harris Administration Enacts Law Banning Importation of Russian Uranium | Department of Energy

Russian Uranium Ban Will Speed up Development of U.S. Nuclear Fuel Supply Chain. U.S. Dept. of Energy. May 14, 2024. Russian Uranium Ban Will Speed up Development of U.S. Nuclear Fuel Supply Chain | Department of Energy

Friday, October 4, 2024

The Montney Formation in Eastern British Columbia and Western Alberta: Geology, Well Production, Opportunities, and Challenges


     For about a decade, the Montney Formation play in Western Canada has been recognized as one of the best shale plays in North America and one of the largest global gas accumulations. In 2013 Canadian oil & gas evaluators determined that the formation could ultimately produce 449 trillion cubic feet of marketable natural gas, 14,521 million barrels of marketable natural gas liquids (NGLs), and 1,125 million barrels of oil. The Montney Formation is a Lower Triassic shale, siltstone, and dolomitic siltstone sequence in the Western Canadian Sedimentary Basin in British Columbia and Alberta. Shale gas extraction in the distal facies of the western part of the basin began in the late 2000s.


     A November 2018 report by Cordax shows the development and future potential of the Montney. Below is an activity map from that time period showing drilling along much of the play’s extent. Several different zones have been targeted in the formation. Some attributes that favor the Montney as a very good unconventional reservoir include high pressure, significant NGL content, large per-well reserves and recoveries, slow production declines, amenability to production enhancement through hydraulic fracturing, intermediate drilling depths, and sweet gas.


     Although the Montney has often been called a shale, it does not contain much actual shale and would be better termed a low permeability or “tight rock” play. There are organic-rich mudrocks in the formation that act as hydrocarbon source rocks. The formation changes facies from larger grain-sized sandstones and siltstone shoreface deposits on the eastern end of the basin to deeper water facies including finer-grained siltstone, shale, and some distal turbidites to the west, as shown below. The Doig formation just above the Montney is also produced in some areas. A cross-section, also shown below, shows the thickness of the formation across the basin. The other figures show basin stratigraphy.


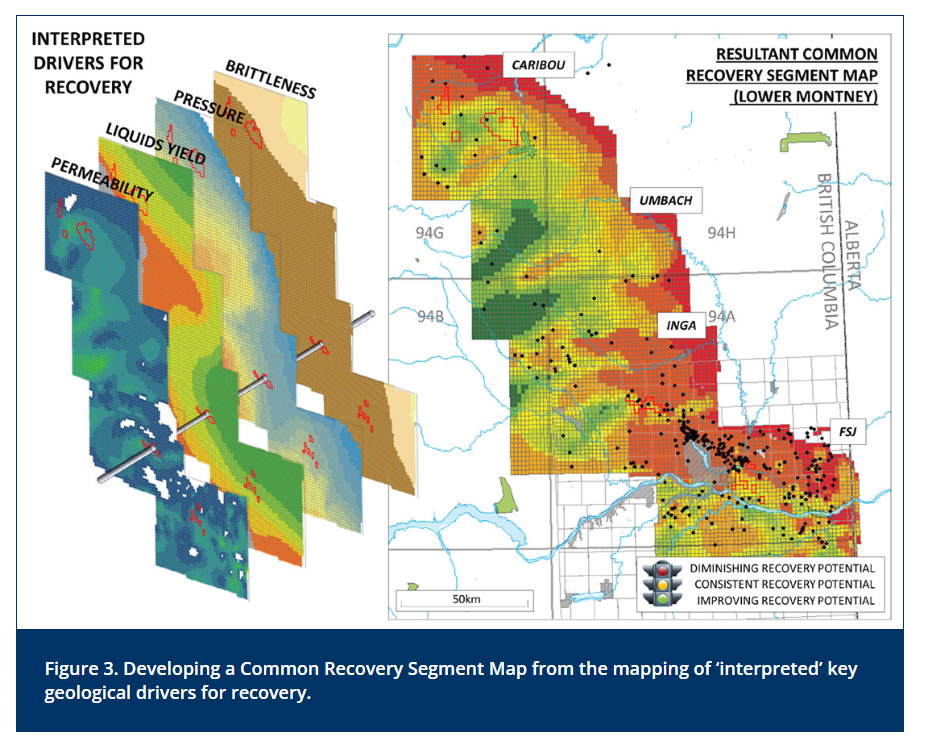
     A March 2016 article by the Canadian Society of Exploration Geophysicists sought to quantify Montney reserves and identify “sweet spots” for liquids, NGL, and dry gas production. Some graphs from that analysis are shown below.


     According to the Canadian Energy Regulator (CER), the Montney Formation contains about half of Canada’s natural gas reserves. That makes it Canada’s premier natural gas play. As of September 2022, it was producing half of Western Canada’s natural gas. The Montney is expected to continue to supply Western Canada’s LNG exports as more export terminals are built. According to researchers at the University of Calgary and the University of Toronto in 2021:


 “They found the emissions intensity of the LNG Canada terminal to be lower than U.S. competitors. It’s a result of Canada’s colder climate, shorter shipping distances to Asia, the use of hydroelectric power, and success in methane emissions reduction.” 


     The Montney is said to rival the Marcellus Shale in the U.S. in reserves. It is less developed than the Marcelus thus far and is expected to drive Canada’s hydrocarbon production, particularly natural gas. According to the Canadian Energy Centre:


Analysts predict that by 2030, roughly two thirds of all natural gas wells in western Canada will target the Montney play, producing about 18 billion cubic feet per day by the end of this decade.”


     The Montney is thought to have had a complex geological history that includes the significant migration of gas condensate. A 2022 paper In Nature Scientific Reports utilized stable carbon isotope and PVT compositional data from produced samples representative of in-situ petroleum fluids to determine that gas condensate migrated. Multiple episodes of internal hydrocarbon migration were identified. Some figures from the paper are shown below.


     A 2021 AAPG paper explains the specifics of the Montney play as an unconventional hybrid petroleum system and how gas compositional mapping reveals that geologic structures controlled hydrocarbon migration routes:


The Montney Formation provides a well-documented example of such a play, in which petroleum distribution is controlled by a combination of downdip increase of thermal maturity, fluid migration influenced by lateral and vertical permeability variations, and pressure compartmentalization.”


We demonstrate that produced gas compositional mapping is a powerful tool that complements comparatively sparse data from core- or cuttings-based organic geochemistry and petrography methods to provide an unparalleled level of detail of petroleum distribution at various scales. Coupling this compositional mapping with reservoir pressure data and published faults reveals a strong control of the structural framework on petroleum migration routes. The main targets of horizontal drilling in the Montney play are carrier beds that were charged by updip migrating petroleum and experienced further thermal maturation during the burial history. The relative contribution of different source rocks to this petroleum system remains speculative, and further investigation is needed to solve this conundrum.”


     A 2021 paper in Marine and Petroleum Geology explored the occurrence and timing of mineralized fractures and how they relate to the development of the Montney-Doig petroleum system.


“…host-rock facies (particularly grain size) and vertical facies changes appear to be the leading factors controlling fracture occurrence. A less relevant role was played by the occurrence of diagenetic carbonates, while TOC possibly did not control fracture occurrence.”


Three generations of calcite cemented fractures were identified. Vertical fractures (first generation) post-dated the onset of oil generation (Late Cretaceous). Horizontal, bedding-parallel fractures (second generation) post-dated the onset of gas generation and possibly opened close to maximum burial, corresponding to peak hydrocarbon (CH4) generation (Late Cretaceous - Early Paleogene). Vertical fractures (third generation) post-dated the horizontal ones and opened during basin uplift (Middle to Late Paleogene).”


Recent Drilling Forecast


     Some important U.S. players in the Montney include Ovintiv, Murphy, and ConocoPhillips. The graphic below from 2021 shows the operators ranked by well count and drilling stats up to that time.


     Calgary-based Precision Drilling made some interesting observations about drilling contracting in a recent article for Natural Gas Intelligence. Precision’s CEO Keven Neveu noted:


Exploration and production (E&P) customers are discussing plans to activate natural gas-directed rigs in the Montney by mid-2025’”


     LNG Canada, a joint venture between Shell plc, Petronas, PetroChina Co. Ltd., Mitsubishi Corp. and Korea Gas Corp. Phase 1 of the British Columbia facility is expected to place around 12.7 million metric tons/year of LNG with first cargoes expected in mid-2025. Montney drilling has been soaring for the past three years in the NGL windows with the pentane supplied as a diluent for Canada’s heavy oil play in Northeast Alberta. Operators have built up an inventory of natural gas. Once that gas begins to be sold as LNG the need to keep that inventory up will grow so rigs are expected to be added. Rig counts have been down for the past year or so. Eventually, the supply-demand cycle will bring them back up a bit eventually. 


     The Precision CEO also noted:


 “We see, certainly for development drilling in Montney, more of a trend for long-term contracts. So they're more willing to sign the contracts than might have been a few years ago.”


Precision is “not anxious to tie up the entire fleet with long-term contracts, but a blend of half the rigs contracted, half the rigs exposed, maybe a little more contracted. It's kind of how we look at things.”


     In a similar manner as LNG exports pick up along the Gulf Coast in mid to late 2025, drilling is expected to pick up in the nearby Haynesville in the Louisiana Salt Basin for export.


The “drilling contractor mix” is likely to “shrink to fewer and larger, more capable drillers rather than the fractured vendor base used by many of those acquisition targets,” Neveu said. “Some of this contractor rationalization is already underway, and we are encouraged by the sophisticated customer interest in automation, safety performance and overall rig performance.”


Challenges Include the Potential for Induced Seismicity

     I attended a talk at the Ohio Geological Society a few years ago about developing “traffic light” systems for the management of induced seismicity events. In these traffic light systems, seismometer networks are deployed to catch induced seismicity events that are likely caused by either wastewater injection or by pressure pumping during hydraulic fracturing operations which can cause underlying faults to slip. These systems pinpoint the source of the seismicity and the individual fault that slips. They are referred to as traffic light systems since they can lead quickly to a temporary or permanent stop of pumping operations depending on the perceived risk. The talk I attended referenced a Western Canadian fault slip seismicity event in the Montney play. Another 2022 paper in Nature Scientific Reports concluded as would be expected that fault slip is a function of injection pressure during hydraulic fracturing in the Montney. The British Columbia area of the play contains a higher number of faults and more induced seismicity events, although seismicity events are also fairly common in the Alberta part of the play. The figures below from the paper show pore pressures, principal stresses, and seismicity events, respectively.


References:


This Emerging Shale Play Is Ripe For The Picking. James Burgess, OilPrice.com. January 28, 2015. Little-Known Small Cap Set To Dominate Montney Shale Play | OilPrice.com

The Montney – A Closer Look. Cordax. November 21. 2018. The Montney – A Closer Look — Cordax Evaluation Technologies Inc.

With Montney Production Set to Grow, US E&Ps Seize Opportunities. Hart Energy. October 1, 2024. With Montney Production Set to Grow, US E&Ps Seize Opportunities | Hart Energy

Look to 2025 for Natural Gas Drilling Gains in Montney and Haynesville, Says Precision CEO. Carolyn Davis. Natural Gas Intelligence. August 7, 2024. Look to 2025 for Natural Gas Drilling Gains in Montney and Haynesville, Says Precision CEO (naturalgasintel.com)

Montney formation. Wikipedia. Montney Formation - Wikipedia

Montney/Doig Resources Play. Birchcliff Energy. 2024. Montney/Doig Resource Play | Birchcliff Energy

Finding Sweet-Spots and Quantifying Recovery Potential in Unconventional Plays: Using the Montney Play as an example of how a Common Risk Segment Mapping approach can be applied to quantifying Estimated Ultimate Recovery in pervasive hydrocarbon systems. Ian J. Cockerill and Aaron W. Hughes. CSEG Recorder. Mar 2016 | VOL. 41 No. 03 |. Canadian Society of Exploration Geophysicists. Finding Sweet-Spots and Quantifying Recovery Potential in Unconventional Plays | CSEG RECORDER

‘Inexhaustible energy’: Top tier Montney play driving the future of Canadian LNG: Montney production to grow significantly through 2050, even under more aggressive climate policies. Deborah Jaremko. Canadian Energy Centre. April 3, 2023. ‘Inexhaustible energy’: Top tier Montney play driving the future of Canadian LNG (canadianenergycentre.ca)

Injection-induced fault slip assessment in Montney Formation in Western Canada. A. Yaghoubi, M. B. Dusseault & Y. Leonenko. Nature Scientific Reports. 12, Article number: 11551 (July 2022). Injection-induced fault slip assessment in Montney Formation in Western Canada | Scientific Reports (nature.com)

Regional Geology of the Montney Resource Play: Western Canada Sedimentary Basin. (short course description). Canadian Energy Geoscience Association. September 2023. https://www.cspg.org/common/Uploaded%20files/pdfs/documents/education/Education%20Courses/Geology%20of%20the%20Montney%20Resource%20Play_Sep.%2025-28%20F.pdf

Massive Montney play ramping up with Canadian LNG exports on the horizon. Deborah Jaremko. Canadian Energy Centre. November 17, 2023. Massive Montney play ramping up with Canadian LNG exports on the horizon (canadianenergycentre.ca)

Geochemical evidence for the internal migration of gas condensate in a major unconventional tight petroleum system. James M. Wood, Jaime Cesar, Omid H. Ardakani, Arka Rudra & Hamed Sanei. Scientific Reports volume 12, Article number: 7931 (2022). Geochemical evidence for the internal migration of gas condensate in a major unconventional tight petroleum system | Scientific Reports (nature.com)

Petroleum distribution in the Montney hybrid play: Source, carrier bed, and structural controls. Tristan Euzen, Neil Watson, Martin Fowler, Andy Mort, and Thomas F. Moslow. AAPG Bulletin. September 2021. AAPG Datapages/Archives: Petroleum distribution in the Montney hybrid play: Source, carrier bed, and structural controls

Natural mineralized fractures from the Montney-Doig unconventional reservoirs (Western Canada Sedimentary Basin): Timing and controlling factors.Aarta Gasparrini, Olivier Lacombe, Sébastien Rohais, Moh Belkacemi, and Tristan Euzen. Marine and Petroleum Geology. Volume 124, February 2021, 104826. Natural mineralized fractures from the Montney-Doig unconventional reservoirs (Western Canada Sedimentary Basin): Timing and controlling factors - ScienceDirect

XI Technologies: Montney Drilling Overview – The Top Operators & Results. March 10, 2021. Energy Now Media. XI Technologies: Montney Drilling Overview - The Top Operators & Results - Canadian Energy News, Top Headlines, Commentaries, Features & Events - EnergyNow

LNG Canada Nears Commissioning Phase for First Train, Fluor Says. Jacob Dick photo. Natural Gas Intelligence. July 11, 2024. LNG Canada Nears Commissioning Phase for First Train, Fluor Says (naturalgasintel.com)

Wednesday, October 2, 2024

BioEnergy with Carbon Capture and Storage (BECCS): Pros, Cons, and Feasibility


     BioEnergy with Carbon Capture and Storage, or BECCS includes CCS with ethanol and other liquid biofuels production, industrial process fueling and co-firing, and wood-burning power plants. For power plants, it is basically harvesting wood to be burned in woodburning power plants, capturing and storing the carbon, and re-planting trees to help mitigate the carbon emissions. Advocates say that life cycle process can be carbon negative. I am very skeptical about that since it may take up to a century to replace the carbon sinks taken away to be replenished. Some of that carbon will also be prevented from being taken up by the soil. Wood burning is also highly polluting, worse than coal according to several studies.

     The main argument in support of BECCS as a climate solution, that it can be carbon negative compared to fossil fuel CCS which can only approximate carbon neutrality, seems legit on the surface, but there are other considerations. There are both environmental challenges and technical challenges. I have written in the past about some of the environmental challenges of harvesting, processing, shipping, and burning densified woody biomass, basically wood processed into pellets. My post highlighted both the significant environmental issues around densified woody biomass and the inefficiency of the process compared to both coal and natural gas.

     Biomass processing and refining of different types, including as ethanol, produces CO2 in different processes as shown below. Both industrial processes and energy plant processes produce CO2 that can be captured. Ethanol refining produces high-purity CO2 that has advantages for optimizing CCS. That is why it has been pursued so much. The IEA reports that BECCS mitigates only around 2 Mt of biogenic CO2 per year and most of that is from ethanol plant CCS. IEA also notes:


Based on projects currently in the early and advanced stages of deployment, capture on biogenic sources could reach around 60 Mt CO2/yr by 2030, which falls far short of the approximately 185 Mt CO2/yr captured from biogenic sources by 2030 in the Net Zero Emissions by 2050 (NZE) Scenario. Targeted support for carbon dioxide removal (CDR), and BECCS in particular, will be required to translate recent momentum into operational capacity.”


    The IAE thinks that BECCS can increase by 30 times the current deployment by 2030, just five years away, while their 2050 NZE scenario requires it to be increased by over 92 times the current deployment! Right now, I doubt that the 30 times increase in that short timeframe is even feasible. IEA gives lead times for BECCS projects ranging from 1.5 to 6.5 years with the average being 3.5 years, with 1 to 2 years being a common lead time for ethanol projects. Thus. ethanol CCS projects will likely continue to dominate BECCS projects. The IEA also notes:


Around 90% is captured in bioethanol facilities, one of the lowest-cost BECCS applications due to the high concentration of CO2 in the process gas stream. The largest operating BECCS project to date is the Illinois Industrial CCS Project, which has been capturing CO2for permanent storage in a deep geological formation since 2018. The Red Trail Energy and Blue Flint bioethanol plants, the second and third in the United States targeting dedicated storage, came online in 2022 and 2023, respectively. Other small-scale bioethanol facilities are capturing CO2 in Europe and the United States, but these either sell the CO2 to greenhouses for yield boosting or use it for enhanced oil recovery.”


    Another issue for BECCS deployment is development of the transport and storage infrastructure for CO2. That will likely slow down deployment. The development of industrial hubs or clusters that share the CO2 infrastructure is one potential solution to lowering costs, but it will take time to get these projects going and to better understand their practical challenges as well as their potential benefits. These projects are still in pilot or demonstration phases and still require significant subsidization, particularly on the transport and storage side which require higher upfront investments. In the U.S. the Midwest Carbon Express project plans to connect 57 bioethanol plants with a pipeline network across 5 states. There has been considerable public opposition to CO2 pipelines, and this will likely slow down the pipeline building process which will slow down the deployment process. The U.S. announced in February 2024 that $100 million will be invested in carbon dioxide removal (CDR) projects, which include all CCS projects, including BECCS.

     Biomass cofiring for electricity production and industrial applications is a current solution that has been commercialized in pulp and paper mills, cement plants, and steel blast furnaces. However, cabon capture for those applications is currently lagging. The IEA graph below compares technology readiness levels.


     Some environmentalists prefer BECCS over fossil fuel CCS since it would not perpetuate the use of fossil fuels. However, it would take a massive amount of land to take up the slack of fossil fuels production with less efficient wood. Detractors (like me) would ask if we really want to pursue burning wood as a climate solution. The concept of “renewable” biomass is not really a sustainable one since it takes several to many decades to replace a mature tree. Wikipedia notes:


Biomass production is subject to a range of sustainability constraints, such as: scarcity of arable land and fresh water, loss of biodiversity, competition with food production and deforestation.”


These issues make BECCS even less suitable for developing countries. No doubt, BECCS projects will increase and offer some carbon offsetting for developed countries, but I do not believe it will be a widespread solution or one that makes much of a dent in emissions reduction overall. The IPPC Sixth Assessment notes:


Extensive deployment of bioenergy with carbon capture and storage (BECCS) and afforestation would require larger amounts of freshwater resources than used by the previous vegetation, altering the water cycle at regional scales (high confidence) with potential consequences for downstream uses, biodiversity, and regional climate, depending on prior land cover, background climate conditions, and scale of deployment (high confidence).”


     Thus, it is a limited solution and one that is not likely to be very significant overall.

     Another issue that limits BECCS suitability is that for the process to be environmentally and economically optimized, power plants would have to be built close to biomass sources to limit transport costs and emissions. That limits where the most desirable BECCS projects can be built.

     Perhaps the most significant issue with BECCS is its thermal inefficiency compared to coal and natural gas. According to the IEA via Wikipedia:


“…biomass in general is a low-quality fuel. Thermal conversion of biomass typically has an efficiency of 20-27%. For comparison, coal-fired plants have an efficiency of about 37%.”


Low energy conversion efficiency, energy-intensive biomass supply, combined with the energy required to power the CO2 capture and storage unit impose energy penalty on the system. This might lead to a low power generation efficiency.”

     The 2019 graph below from the Rachel Carson Institute shows this issue pretty clearly.


Source: Clear Cut: Wood Pellet Production, the Destruction of Forests, and the Case for Environmental Justice. Rachel Carson Institute. 2019. sec.gov/files/rules/petitions/2019/ptn4-741-exb.pdf


     The bottom line about BECCS is that it will likely be a limited climate solution.


References:


Maybe we don’t have to capture so much carbon, study suggests. Justine Calma. The Verge, June 13, 2024. Maybe we don’t have to capture so much carbon, study suggests (msn.com)

Bioenergy with carbon capture and storage. Wikipedia.  Bioenergy with carbon capture and storage - Wikipedia

Bioenergy with Carbon Capture and Storage. International Energy Agency. Last updated April 2024. Bioenergy with Carbon Capture and Storage - Energy System - IEA

Clear Cut: Wood Pellet Production, the Destruction of Forests, and the Case for Environmental Justice. Rachel Carson Institute. 2019. sec.gov/files/rules/petitions/2019/ptn4-741-exb.pdf


Tuesday, October 1, 2024

India’s Coal Mine Methane Emissions Set to Grow Significantly, According to Ember: Is it a Mitigation Opportunity? Most of India’s Methane Emissions Come from Agriculture (72%) and from Livestock (48%), Mainly Cows


     Global methane emissions are at record levels and record growth rates. India ranks third out of all countries for total methane emissions. Most of those emissions, however, about 72%, come from agriculture, and most of those come from cows. A recent report from Ember details the expected growth in India’s cola mine methane emissions as new mines are opened and other ones expanded. They predict that coal mine methane emissions could double by the end of the decade if capture and mitigation are not optimized.  

     While most of India’s recent mine developments have been surface mines which do not release as much methane as underground mines, the forecast is now for underground mines to triple. Ember also notes that by applying the right mitigation technologies, India could limit those emissions considerably. According to the Independent:


Techniques like pre-mine drainage, which involves extracting methane from coal seams before mining starts; ventilation air methane oxidation, which captures methane from mine ventilation systems; and flaring, which burns off methane and turns it into less harmful carbon dioxide, can help capture methane and convert it into a useful energy source.”


     Addressing coal mine methane has some important co-benefits. Most important is that it makes mines safer for miners as gas explosions are a very real and potentially devastating danger. Second, other components in methane can increase local ground-level ozone which is a serious air pollutant.

     Between 2010 and 2019 methane emissions decoupled somewhat from cola production as underground mining slowed relative to surface mining as shown below. In 2022, 96% of India’s coal came from surface mines and only 4% from underground mines. Underground mines are much ‘gassier’ than surface mines. Power demand in India is growing rapidly. Coal currently powers about 212 GW of electricity (2023) and that is expected to grow to 260 GW by 2031. That is a 48 GW increase.


     Like China, India is still considered to be a developing nation with a developing energy sector and economy that is still ramping up to provide energy access and more power for industry and commerce. Thus, its emissions are expected to peak much later than in developed countries, where they have already peaked in many countries. Different analyses suggest different mitigation costs for India’s coal mine methane emissions, but Ember thinks that emissions reductions of 7% per year from the new mines is achievable. Of course, methane emissions mitigation has the incentive of the captured emissions being a sellable energy product. Ember considers their predictions conservative noting:


Under the more conservative mitigation scenario presented in this report, we estimate that a moderate roll out of coal mine methane mitigation technologies across underground and surface coal mines could save more than 1,600 kt of methane between 2025 and 2030. If this gas was captured and utilised as electricity, offsetting the use of imported gas, it could save up to $980 million USD over the next five years.”


     There are currently no methane mitigation projects operational in India. Therefore, the potential is big for mitigation. Methane mitigation potential varies by mine and is also dependent on mine design, geology, and operational practices. Cost considerations are important and suggest that the lowest-cost solutions such as flaring will be implemented first. If the captured methane is to be used for fuel, then additional investments will be needed.


Overview of India’s Total Methane Emissions with an Emphasis on Livestock


     India is the world’s largest producer of milk, with 80 million dairy farmers producing 231 million tons of milk in 2023. There are bout 303 bovine cattle in India, which includes cows and buffalo. As mentioned, agriculture makes up about 72% of India’s total methane emissions, and livestock alone account for 48%, about half, of India's total methane emissions. One solution being tried is feeding cows more nutritious food aided by genetic improvements which increase their milk production, meaning that fewer cows are needed for the same amount of milk production. It is estimated that this could reduce methane emissions from cows by about 15%. Projects involving new feeds to reduce methane production via reducing enteric fermentation in cows, on the other hand, have resulted in less milk production per cow which severely limits its effectiveness in addressing the issue. This means that these solutions are not currently sustainable since more cows would be needed to produce the same amount of milk.  


Climate-smart dairying is the need of the hour,” said Meenesh Shah, chairman of the National Dairy Development Board.


     Other solutions include utilizing more local breeds that emit less methane. The problem of livestock methane emissions is not likely to improve very much. The emissions are dispersed and can’t be captured, compared to energy sector emissions. The effects of mitigation requirements on India’s farmers, many of which are poor, must also be considered.


References:


India’s methane emissions from coal mining are set to double – but it can be put to good use. Stuti Mishra. The Independent. September 19, 2024. India’s methane emissions from coal mining are set to double – but it can be put to good use (msn.com)

India has millions of dairy farmers. It's creating a methane problem that's tricky to solve. Sibi Arasu. The Independent. March 23. 2024. India has millions of dairy farmers. It's creating a methane problem that's tricky to solve | The Independent

Coal mine methane’s critical moment in India. Chris Wright, Rajasekhar Modadugu, and Bandish Patel. Ember. September 19, 2024. Coal mine methane’s critical moment in India | Ember (ember-climate.org)

Distribution of methane (CH4) emissions in India in 2020, by sector. Statista. 2024. India: methane emissions shares by sector | Statista


  As the title of this post points out, the U.S., China, and the EU countries make up about two-thirds of UN funding in a normal year. The...