Sunday, May 26, 2024

Book Summary and Review: Not the End of the World: How We Can Be the First Generation to Build a Sustainable Planet. By Hannah Ritchie, Deputy Editor and Lead Researcher of Our World in Data. (Little Brown Spark/Hachett Book Group, 2024).


     For more than a few years now I have been reading short interpretations and explanations of data by Hannah Ritchie on the Our World in Data website. I was delighted when I saw her on Amanpour and Company and decided to get her new book. Ritchie is in the ‘gen y’ age range of 25-40 and I think perhaps she can communicate some realities about data to younger people. In this book, as a Ph.D. data scientist, she utilizes the data as much as possible to arrive at conclusions regarding risk levels, risk perception and misperception, and policy. She also points out the many misconceptions and fallacies among environmentalists as she considers herself an environmentalist as well but of a more pragmatic and less aspirational type.

     Through the course of the book, she dispels various myths and misconceptions that had become dogma among environmentalists. She also recounts some of her changes in position and policy regarding a few different topics. These changes came about due to the data showing that her previously held positions were not supported by the data. A well-known axiom is: ‘The data doesn’t lie.’ Analyzing data is a preceding step to determining what is true or not true. As a data scientist for a company that compiles and presents global data, she has a front-row seat in analyzing data. In presenting results from data analysis there are responsibilities to show the limitations of data interpretations. Data and its interpretation can be manipulated, cherry-picked, full of caveats, and presented in various skewed and incomplete ways, often to favor a certain narrative being promoted.

     The chapter headings reveal the subjects addressed: sustainability, air pollution, climate change, deforestation, food, biodiversity loss, ocean plastics, and overfishing. These represent many of the major environmental challenges for our global society. These, she deems are the world’s biggest environmental problems. As expected, this book is full of graphs and charts.

     She begins by dissing the catastrophist narratives that have been spread in recent years, resulting in children being bombarded with environmental pessimism. She believes that the data shows that we are making important headway on some problems and others are not as bad as depicted. She argues that in many cases the data does not support catastrophist interpretations, but rather optimistic ones. She tells how hearing Swiss physician, statistician, and public speaker Hans Rosling speak one night, impacted her and her views. Rosling was famous for showing people that they very often have their facts about the world wrong, that they are not integrating global data into their policy opinions. Things are often not as bad as depicted in the media and in society in general. I would recommend Stephen Pinker, Bjorn Lomborg, and Ted Nordhaus as other thinkers revealing similar results. It is the data that is most important. She argues: “If we want clarity we have to take in the full picture, and that means giving ourselves some distance. If we take several steps back, we can see something truly radical, game-changing and life-giving: humanity is in a truly unique position to build a sustainable world.”

     She argues that doom is a huge exaggeration, and I would add that an exaggeration is fairly synonymous with a lie. Interestingly, she also argues that these exaggerations tend to undermine the reputations of scientists and erode trust in science, even as they are proved wrong as many are. She also takes on the shift to the goal of keeping global warming under 1.5 deg C temperature rise. That goal was always considered non-attainable and by putting catastrophic impacts at that threshold we add to the impending sense of doom. We don’t really know what average global temperature increase will trigger catastrophic impacts. The same can be said for the activist group 350.org. We don’t really know whether 350ppm is better than 400ppm. We do know that we need our atmospheric CO2 concentration to peak at some point and then begin to drop. There are some important benefits like better plant growth and global greening at our current CO2 concentration of 425ppm.

     In opposition to the radical group Extinction Rebellion who argue that they are the last generation, Ritchie argues that we can be the first generation to achieve a sustainable world.

She notes that while our environmental challenges are big and important, they are not our major existential risks, and that we need to be realistic in comparing facts, acknowledging progress toward solving problems while also acknowledging that they are still major problems.

     In the first chapter about sustainability, she notes that “the world has never been sustainable.” Of course, people often forget this or perhaps never learn it, being deceived that the past was without serious environmental problems. She uses the 1987 UN definition of sustainability as “meeting the needs of the present without compromising the ability of future generations to meet their own needs.” Thus, there are two aspects: meeting present needs and preserving future needs. One is mostly human well-being, and the other is mostly environmental protection. Both are necessary and she argues that we have never achieved both so that is why the world has never been sustainable.

     With graphs she shows our very important improvements in child and mother mortality, life expectancy, in addressing hunger and malnutrition, access to basic resources like clean water, energy, and sanitation, education, and extreme poverty. She also points out two approaches that will not help fix our problems: depopulation and degrowth. Ending poverty requires economic growth as redistribution alone would fall very far short. The wealth that economic growth provides also helps us better address our environmental problems.

     The section on air pollution points out how it has improved in many places, including in Beijing, China, falling there by 55% between 2013 and 2020.


Indoor fires have been polluting the lungs of people for millennia, even 400,000 years ago as analysis of the teeth of hunter-gatherers in Israel showed. Indoor and outdoor wood smoke has long been a major pollutant and continues to be in many places. We all know about the London smog and other events where toxic coal smoke was implicated. We now know much about the effects of black lung disease, silicosis, and other lung diseases from coal dust, silica dust, and other dust. But there are success stories like addressing acid rain, the hole in the ozone layer, and the reduction in sulfur dioxide and NOx emissions in many countries. The following graph is for the UK but mirrors other developed countries.


These successes show that we can solve many of our environmental problems and that we can do it with sufficient global cooperation. In many cases the air we are breathing now is cleaner than the air our ancestors breathed. Passing peak air pollution has been achieved in many developed countries and is beginning to occur in developing countries. Even so, air pollution still causes many premature deaths. She thinks that we are approaching the peak of deaths from air pollution and that they will eventually sometime soon begin to trend downward. Air pollution deaths per capita have been falling steadily for decades in many countries and in the world as a whole.

     While she says the solution to air pollution is to stop burning stuff, that is of course, not at all a practical solution at present. Useful solutions to reduce air pollution include use of cleaner cooking fuels, reducing crop waste burning, de-sulfuring fossil fuels like diesel, and more replacing of fossil fuels with renewables and nuclear energy. She points out that while we worry about climate change killing people in the future, air pollution has long been killing people and continues to do so.

     In the chapter on climate change she points out that it was once thought not so long ago that we were headed to 4-6 deg C of temperature increase. Now, it seems likely that we can keep it reasonably below 2.5 deg C of increase, much closer to the original goal of 2.0 deg C. 1.5 deg C seems quite unlikely in nearly all scenarios. Ritchie is more optimistic that we can hit the 2.0 target. I think we will likely be closer to 2.5 deg unless technology catches up. She also shows how she got caught up in catastrophism when she was younger due to what is known as the risk perception gap, the gap between perceived level of risk and real level of risk. Seeing the data removed the gap. She also points out how our improvements in disaster mitigation and extreme weather preparedness can help us adapt to climate change impacts. Importantly, she points out that while total global greenhouse gas emissions are still rising, emissions per person have peaked. This happened a decade ago and she notes that it is a fact that is very rarely acknowledged. Total emissions are also expected to peak soon. She mentions the importance of using similar metrics to compare and how the thorny issues of assigning values or attributes to certain emissions sources can be exploited in arguments. She also points out that her own and indeed our own carbon footprints are less than those of our grandparents, less than half in her case. Technology has enabled that change. Energy use per capita has dropped by 25% since 1960.  Technology leads to better efficiency which allows us to do more with less and to grow our economies while reducing emissions. She points out the use of trade records to quantify the “offshored” emissions so that proper emissions accounting is practiced. Offshored emissions uncertainties have been a point of disagreement with catastrophists often arguing that they are much more than they really are. She notes that in the UK since 1990 GDP per capita increased by 50%, domestic emissions have been halved, and consumption-based emissions (those accounting for offshored emissions as imported emissions) have dropped by one third. Thus, as the following 2nd graph shows, many countries have decoupled economic growth and greenhouse gas emissions.


The ‘Energy Ladder’ The dominant energy source for cooking and heating, by level of income.


While she points out that solar, wind, and battery costs have continued to drop though time, she probably went to press before the rising interest rates made costs soar in those sectors. A pie chart showing the sources of emissions shows the main issues we must address if we are to solve climate change.


She notes that coal use continues a steady drop in many countries and globally. She also notes some of the issues with wind and solar like land use and minerals demand. She doesn’t mention much or anything about the challenges and costs of integrating intermittent and variable energy sources.

     She considers transport and the footprint of an EV vs. an ICE vehicle, noting that global sales of new petrol cars peaked in 2017. In considering the emissions of food she offers the following solutions: 1) Eat less meat and dairy, especially beef. 2) Adopt the best and most efficient farming practices we can. 3) reduce overconsumption. 4) Reduce food waste. 5) Close yield gaps across the world. The graph below compares the emissions of different meats and plant proteins.


Plant-based foods are better for the climate Measured in kilograms of carbon dioxide equivalents (CO2e) per 100 grams of protein.


     She covers the challenges of decarbonizing the heavy industry sector. Currently, the best and most feasible solutions are things like carbon capture. She also considers the pros and cons of pricing carbon.

     In considering climate change adaptation she offers the following three necessities: 1) Pull people out of poverty.  2) Improve the resilience of our crops to drought, floods, and a warming world. 3) Adapt our living conditions to deal with sweltering heat.

     At the end of the chapter, she offers some interpreted data that shows gaps between the footprints of certain actions in emissions savings vs. what people think is most effective, as in the graph below.


     The chapter on deforestation reports that the data shows that we can be cautiously optimistic about tackling deforestation. Forests have been restored in many developed countries after vast deforestation in the 19th century and early 20th century. She points out that in the past it was coal that allowed some countries to decouple their population and economic growth from deforestation. She notes that the earth has lost one third of its forest since the end of the last Ice Age about 10,000 years ago. When considering palm oil as a driver of deforestation she expected it to be a big one but found out instead through analyzing the data that the problem was more complicated. Estimates from the Union for Conservation of Nature (IUCN) for global tree loss driven by palm oil ranged from 0.2% to 2%. 85% of palm oil comes from Indonesia and Malaysia. Many of the palm oil plots there had previously been logged for wood and paper. She considers recent backlash against seed oils due to their perceived health effects but notes that she found no credible evidence to support those perceived health effects, which result from a perception that omega 6’s are linked with inflammation, which has not been established. Palm oil is considered to be a seed oil. Palm oil is very productive compared to other oils in oil per hectare, 2.6 tonnes per hectare vs. 0.3 tonnes per hectare for olive oil. Yet, due mainly to the media most people perceive palm oil to be an environmentally unfriendly crop.


     Deforestation is really mostly about converting forests to agriculture and grazing, which make up to 75% of deforestation. A big part of that is beef grazing, which adds much to the carbon footprint of beef cows. Deforesting to grow foods for oils, the two biggest being soybean oil and palm oil, make up 18% of global deforestation. Her suggestions for solving deforestation include 1) Zero-deforestation policies, not boycotts. 2) Eat less meat, especially beef. 3) Improve crop yields – especially in sub-Saharan Africa. 4) Rich countries should pay poorer countries to keep their forests standing.  In many of these suggestions the details would need to be worked out to the agreement of all parties, no easy task. She notes that cities have magnitudes less impact on forests than does agriculture, and many benefits as well. Plant-based ingredients like soy were implicated in deforestation in Brazil in the 1990’s and early 2000’s but the vast majority of soy is actually used in animal feeds and should be attributed to animal agriculture. A mere 7% of soy production goes to vegan products like tofu, soymilk, and veggie burgers. Most of the soy that humans consume is in the form of soybean oil. Most of the animal feed is used to feed chickens, See the graph below.


     In the food chapter, she disses catastrophic predictions about food availability as nonsense. The data clearly support her position here. While issues like soil depletion and degradation are real, they are regional and the data show that soil is degrading in some agricultural areas while improving in others. She goes through the human history of farming. Farming has always had environmental impacts, and this continues. She recounts the development of the Haber-Bosch process for making fertilizer and reminds me of one of the Our World in Data graphs that was very impactful to me. Shown below, it shows how many people are supported by synthetic fertilizer vs. how many are not. The other technological advancement in food in the 20th century was the selective breeding of food crops as best exemplified by the developments of crop scientists like Norman Borlaug. It was Borlaug’s Green Revolution that sunk biologist Paul Ehrlich’s extremely pessimistic predictions of massive global starvation. Not just animal feed but biofuels as well consume significant amounts of our food production, as shown below.


Ritchie points out that meat is an inefficient way to get calories. Smaller animals are more efficient than larger ones, but the amount of energy, water, and food inputs far exceeds the output in terms of calories. Just comparing feed inputs to caloric output, the graphic below shows the size-efficiency relationship.


She points out that food is related to many of our environmental problems. Freshwater resource scarcity, deforestation, biodiversity loss, water pollution, soil erosion and degradation, fertilizer runoff, and more implicate our food systems. Livestock agriculture is the biggest source of many of these issues. She says that land use and managing inputs like water and fertilizer are the two biggest problems with farming. She rightly points to agricultural intensification as one of the best and most beneficial environmental improvements. Increasing yields saves land, habitat, and resources. She considers that we may be close to peak agricultural land (including animal agriculture). She analyzed the data and concluded that peak agricultural land occurred around 2000. Breaking it up though, she thinks that we have long passed peak grazing land but have yet to pass peak farmland (plants only).

     She also sees peak fertilizer on the horizon. It peaked in rich countries long ago, beginning to peak in the U.S. back in the 1970’s. All these examples show that we can and have improved our environment and that we continue to be more efficient and to do more with less. Fertilizer use decreased also due to being used more wisely by wasting less, better targeting, and better timing. Ritchie’s recommendations for building a more sustainable global food system include the following: 1) Improve crop yields across the world (Africa is lagging here and needs to be prioritized). 2) Eat less meat, especially beef and lamb. She states: “We would cut emissions, land use and water use by much more if half the population went meat-free two days a week than we would from increasing veganism by a few percent. It’s a good idea in theory but I have my doubts. 3) Invest in meat substitutes: building burgers in the lab. 4) build a hybrid burger. Meat substitutes, of course, have a much lower emissions footprint than meat. 5) substitute dairy with plant-based alternatives. 6) Waste less food. Apparently, studies show that we would waste less food if people had more containers, ie. “Tupperware.” Increased refrigeration from farm to market would also be helpful in keeping produce fresher and making it last longer. 7) Don’t rely on indoor farming. While it can increase yields the energy inputs are very high relative to outdoor agriculture. It is only good for a few crops at present. They won’t feed the world, she says. She also points out that the benefits of eating local are usually less than not eating local. It’s a myth, she says. However, she also notes that most people think erroneously that eating local has more environmental benefits. She provides some good graphical evidence showing that vast majority of emissions come from local delivery via roads rather than from rail, ships, or planes, which are more efficient ways to deliver food. She also points out that eating organic is often or at least not always better for the environment. The main reason is lower yields which leads to higher land use. She also mentions the disaster that occurred in Sri Lanka when the country banned synthetic fertilizers which caused food production in the country to plummet, and the policy had to be rolled back. Vandana Shiva should take note. Studies have shown that pesticide levels in food are at very small levels with the majority of foods (75%) having pesticide levels at just 0.01% (one 10000th) of the limits given for harming human health. Another thing she notes is that the detriments of plastic packaging are often overhyped.

     In considering biodiversity loss she notes that the metrics used to measure it are often tricky. She even recounts an event in the past where she misinterpreted the statistics of one study that erroneously depicted the decline of the world’s animal populations. She considers why we value biodiversity, and that some species are more needed by us and ecosystems in general than others. She notes our history of causing biodiversity loss beginning with hunting out of the megafauna in many places around the world by our much less numerous ancestors. The 1st graph below shows human-caused extinctions all over the world in our prehistoric past. The 2nd and 3rd graphs show the loss of large mammal biomass due to humans and the current mammal biomass dominated by humans and their livestock. I found this one a bit shocking. The 4th graph shows the changes in time of both.


The graphs above do not include wild birds or poultry, but the story is similar with our biomass of just chickens twice as much as the biomass of wild birds.

     She also considers the studies that suggest an “insect apocalypse” are overhyped and the problem is not nearly as bad as often depicted. Decrease in insect populations are occurring in some places but they are increasing in other places. She also considers the catastrophists that say we are heading for a sixth mass extinction. While extinction rates have indeed increased, they are nothing like the event-caused mass extinctions of the past. She also points out that wildlife has returned to some places where it had declined, through human conservation efforts. She shows graphs that prove this. She states that: “Overhunting and agriculture have been responsible for 75% of all plant, amphibian, reptile, bird, and mammal extinctions since 1500.” That remains concerning, of course.

     She points out that we often have selfish motivations for environmental improvement. Preventing respiratory problems is a motive to mitigate air pollution and preventing skin cancer was a motive to fix the ozone layer are examples.

     Her recommendations for preventing mass extinction include protecting the most diverse sites from exploitation. Land conservation is an example. She notes that there are different levels or degrees of conservation from strict to loose. More recommendations include: “Increase crop yields to reduce farming land. Bring deforestation to an end. Eat less meat and reduce our need for livestock. Improve our efficiency of, but don’t eliminate, chemical inputs such as fertilizers and pesticides. Slow global climate change, Stop plastic leaking into our oceans.” These are all practical and crucially, achievable goals and several of them are indeed happening. Of course, much more is needed.

     The chapter about ocean plastics points out some debunked catastrophist predictions of more plastic than fish in the ocean by 2050. Plastic pollution is a major issue with ocean plastics, microplastics in water, soil, air, and in us, and in freshwater and on land. Plastic does indeed harm many sea creatures, including whales and turtles.

     Ritchie points out the many benefits of plastic: “It’s sterile, waterproof, versatile, and cheap.” It reduces food waste considerably. Plastic makes vehicles lighter and so reduces the emissions of transport. So many valuable things and devices are made of plastic. It is a wonder material, and its green credentials should balance its perceived environmental harms. It also makes our lives more convenient and more efficient in many ways. The great durability of plastic also means it breaks down slower if discarded in the environment. She goes through some of the data on plastic use. People in the U.S, use far more plastic than those in India, for instance. Plastic use is greater in urban areas. Packaging is the world’s biggest use of plastic, about 44%. Buildings, textiles, transport, and other consumer appliances are the other big users of plastic.

     In considering solutions to plastic pollution the important thing to tackle is where plastic ends up as discarded waste. Most plastic waste goes to landfills. Some is recycled, usually just once or twice. Chemical plastic recycling is possible but very expensive. Thus, it will remain limited in use until it gets cheaper. The key to solutions is keeping discarded plastic out of the environment aside from landfills. This is a waste management problem. Many counties have inadequate solid waste management. Open landfills are also problematic and much more likely to release contamination into the surface environment, including plastics. She points out a study that determined that 81% of global plastic pollution entering the ocean comes from Asia, which does hold 60% of the world's population. In other regions coastal plastic pollution coming from rivers is often an issue.

     She considers the issue of whether rich countries are dumping plastics overseas. This was happening on a large scale in China until China stopped accepting plastic waste in 2017. Other Asian countries are following suit. Perhaps we would be better off landfilling here rather than collecting it and sending it by ship to the other side of the world where it often ends up in open landfills and gets blown and washed into rivers and then the ocean. Now Europe has replaced Asia as the biggest importer of plastic waste. The graph below shows the drastic changes:


She points out that we really don’t know how the pervasive microplastics in our bodies will affect us through time. She notes that plastic pollution is probably the most solvable problem in the book. Rich countries should stop exporting plastic waste to countries with inadequate solid waste management and we should help them develop their solid waste management capabilities. This requires investment. She notes that while recycling is good and necessary it also has a more limited effect than people realize due to required energy inputs. She also says we should expect more cooperation and innovation from industry. The producers of plastics and plastic products should develop the circular economy by making that plastic and those products more recyclable. Industry also needs to lead on chemical recycling, she says. She advocates for stricter policies on plastics in the fishing industry since plastic fishing nets and other equipment is a major source of ocean plastic waste. She notes progress on cleaning up the Great Pacific Garbage Patch and other new technologies to gather and capture ocean plastic. She sees plastic straws and single use plastic bags as minor plastic pollution that can simply be managed better, and I agree. To end the chapter, she points out that modern well-designed and well-landfills are probably the best way to deal with solid waste.

     In considering overfishing she points out another catastrophist study that was full of inaccuracies that concluded that global collapse of fish populations would happen at some point in the future due to overfishing. The study was strongly rebutted by other marine scientists. She covers the history of whaling, its global peak in the 1950’s and 1960’s, and its dramatic fall to pre-1900 levels by 1990. She also recounts the history of ocean fishing including the development of steam trawlers in the 1880s. Fishing is now about sustainable management of what’s considered to be an ocean resource. The goal is to fish without lowering fish populations as has occurred in several species in several parts of the ocean. As the graph below shows, about one-third of global fish stocks are considered to be overexploited.


We also now farm more fish than we catch. Fish have basically become livestock. Aquaculture has gotten much more efficient and plant-based feeds are lowering the number of wild fish used for feed. Thus, those that eat fish need to get comfortable with eating farmed fish. Tuna, cod, haddock, and salmon have become more sustainably managed in the wild. She advocates for better monitoring of fish populations, especially in Asian waters offshore of China and India. She recounts the problem of coral bleaching and how not only climate change but overfishing, sewage dumping, fertilizer runoff contributes to it. Her recommendations for solving overfishing include eating less fish, eating the most sustainable fish, implementing strict fishing quotas, implementing stricter regs on by-catch and discards (less bottom trawling means less discards of fish often injured or killed – discards have been decreasing; more by-catch has been marketed rather than discarded), and don’t be overly optimistic about marine-protected areas.  

     In her conclusion she notes that while progress in sustainability is variable across the globe, every country has improved in education, health, nutrition, and other spheres. She talks about “leapfrogging” fossil fuels to go directly to from more primitive fuel sources like wood to wind and solar as being essential to solving climate change. I disagree, especially in the near-term. Poor countries need affordable energy and reliable dispatchable energy more than they need sustainable energy. That sustainable energy is more expensive, especially when the required reliability and dispatchability become necessary fossil fuel add-ons. At some point we may get there but that time is not now.

     Changing how we eat will be important to improving our global sustainability and these changes often should emphasize simply eating more of what’s sustainable and less of what is not. She notes that being an effective environmentalist often means debunking established environmentalist paradigms of activists. She advocates for systemic change, obviously more potentially effective than small individual changes. At the end she also advocates for joining people headed in the same direction, although that would depend on how they plan to get there.

     I would conclude by reiterating that this a very good book, especially for a younger (I’m old so by younger I mean maybe 20-40) readership. I think it is very important to be practical and realistic about our environmental problems and the best way to do this is to study and analyze the data to arrive at the best conclusions.

Sunday, May 12, 2024

Longer Wells Mean More Production from Fewer Rigs: Repost of a Linked-In Post by Ted Cross of NOVI Labs (w/commentary and additional graphs)

Ted Cross of NOVI Labs gave some great perspective in this post about longer well laterals. He also breaks it out into regions, showing that half of the increase is in the prolific Permian Basin as expected. Looking at the data like this shows the great improvements in efficiency as measured by drilling productivity, or production per rig.

"Just how much have oil and gas operators been drilling? While the rig count gets most of the attention, lateral miles drilled is more directly related to production. Viewed this way, operators have been very active over the last few years." 


“In April 2023, Lower 48 operators put 2,144 lateral miles onto production, just short of the previous peaks found in 2018-2019. This is despite the rig count being ~25% lower in 2023, thanks to longer laterals and improved drilling efficiencies.

“Zooming in, the Permian represented half of this total, putting on 1,088 miles in April 2023. For context, this is about as far as Midland is from Mexico City -- an incredible distance to drill in a month. The Permian has comprised over 50% of lateral miles drilled in Lower 48 in the post-COVID cycle.

“The Uinta, Haynesville, and Powder River also had impressive runs during the latest cycle, peaking at fresh highs of 94, 141, and 293 miles, respectively. While much smaller than the Permian, those numbers do add up!

“Looking forward, long laterals and drilling efficiencies will continue to be a major theme in Lower 48 development. With ExxonMobil planning 4-milers in the Permian and Appalachian operators breaking an average of 13,000' (!!), the longer lateral train shows no signs of stopping.


His graph below shows those results. Below that graph, I am adding graphs of rig count and oil & natural gas production over the same time period. I also added a graph of drilling productivity vs. rig counts for the Appalachian region over a roughly similar period. All data is from EIA with EIA utilizing Baker Hughes rig count data:


Sunday, March 31, 2024

Update on Carbon Utilization: Economics, Projects, Challenges, and Forecasts


     The utilization of captured carbon is an important component of decarbonization. Currently, the vast majority of utilized captured CO2 is used for enhanced oil recovery. That is about to change according to forecasts. Due to tech advancements and generous incentives from the Bipartisan Infrastructure Bill and the IRA the U.S. is on the verge of increasing the utilization of captured CO2. The DOE’s Office of Fossil Energy and Carbon Management developed a grant program in 2022, their Carbon Utilization Program, that “is designed to establish a grant program for state and local governments to procure and use products derived from captured carbon oxides.” Initial funding was $310 million. Currently, there are many start-ups focused on developing economic solutions to carbon capture, removal, utilization, and storage. Some of these may be able to take advantage of such grants to further develop those solutions.

     The graph below shows the different carbon utilization possibilities. Aquaculture can utilize carbon in biomass to yield algae through dewatering, to yield biochar, biogas/syngas, or biocrude through conversion, or to yield lipids, proteins, or carbohydrates through fractionation. Through carbonization, carbon can be converted to inorganic materials which can yield biocarbonates, carbonate aggregates, carbon cements, and other inorganic materials and chemicals. Carbon can be converted into fuels and organic chemicals via two methods: biotic synthesis and abiotic synthesis. Biotic synthesis can yield neat fuels and blendstocks, commodity, specialty, and fine chemicals, and emerging biochemicals. Abiotic synthesis can yield comm oddity, specialty, and fine chemicals through carbon insertion. Through carbon coupling abiotic synthesis can yield C2 basic chemicals, graphite, and carbon. Through C1 reforming abiotic synthesis can yield CO, syngas, and C1 basic chemicals. Captured carbon can also be used as a working fluid to provide services, mainly for improved resource recovery. Crude oil, natural gas, coalbed methane, groundwater, wastewater, and geothermal energy can all utilize CO2 as a working fluid to improve recoveries.


Source: US DOE/NETL


     IDTechEx forecasts that the percentage of captured carbon used for enhanced oil recovery will drop from the current 90+% to about 50% by 2044. That does not mean that enhanced oil recovery won’t increase, just that it will be less of the total share of captured carbon utilized. They also forecast that CO2 conversion to fuels and to building materials, in roughly equal measure will dominate the new uses for captured carbon as the graph below shows. Conversion to chemicals and biological products will make up a much smaller share.


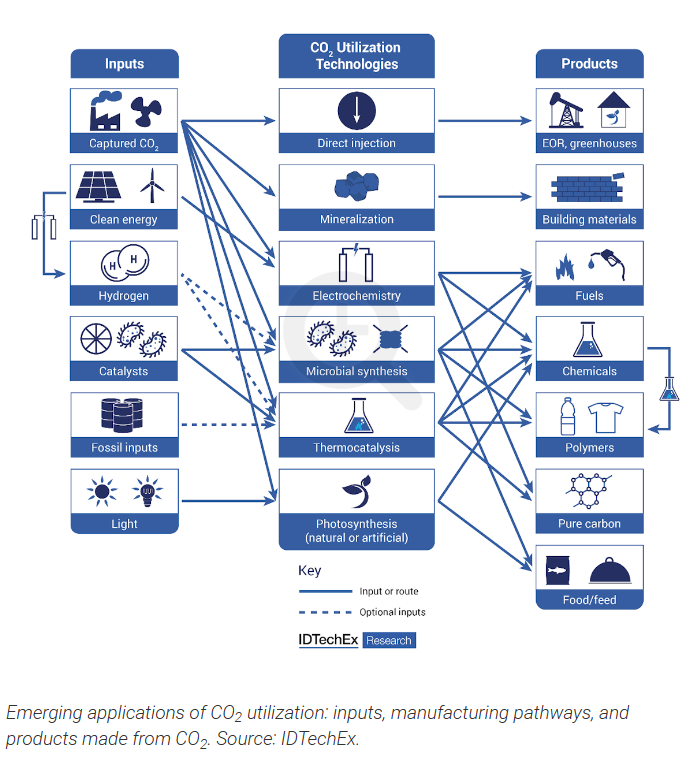
      IDTechEx predicts that by 2044, utilization of waste CO2 will reach 800 Mt, creating over 3,000 Mt of useful products. Of course, CO2 converted to fuels and some chemicals and other products will be burned or consumed, re-releasing the captured CO2 to the atmosphere, but without any new CO2 being generated. Other products like CO2-imbued building materials and biochar will be sequestered for a long time. CO2 sequestration into deep saline reservoirs offers the longest-term storage. Government requirements, mandates, new regulatory rules, and incentives are expected to help fuels and building materials to utilize more captured CO2. They also note that CO2 utilization for crop enhancement in greenhouses is expected to grow as new CO2 pipelines are constructed and filled. The graph below shows emerging applications for the utilization of captured CO2. They also note that some chemicals such as CO2-derived polycarbonates are already produced commercially but they do not require very much CO2 to make, and that chemicals that require non-reductive pathways are the most promising due to a smaller energy demand.


     A paper published in November 2019 in Nature addressed the technological and economic prospects of CO2 utilization and removal. The authors also pointed out some co-benefits od certain utilization pathways. One example is land-based CO2 sequestration into products like biochar can increase agricultural yields and soil health. Another example is that the use of carbon in construction materials can reduce the amounts of other materials required as well as offering a fairly permanent storage solution. The paper provides ten potential utilization pathways that can be scaled up to utilize over 0.5 gigatons of CO2 annually each. The ten pathways are shown in the graphic below of stocks and net flows of CO2 in the environment and in the table below:


CO2 flows from the different types of utilization and removal are shown below.


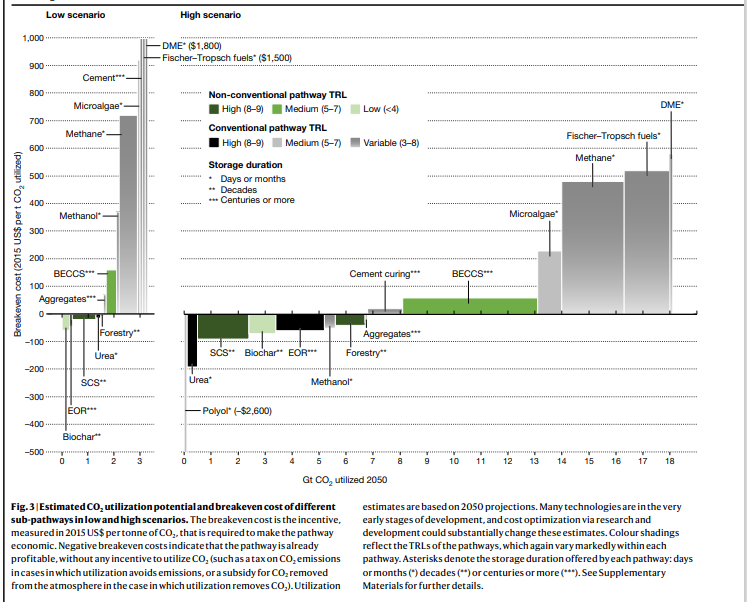
The last two graphs from the paper address economics and breakeven costs for 2019. Since then, some costs likely have risen due to inflation and higher borrowing costs but that is likely to have been more than offset by new subsidies and incentives as well as some technological improvements. The authors mention a few possible tech improvements that could decrease costs: “The emissions-reduction potentials of the three cycling pathways would be facilitated by declines in the costs of CO2 capture. New sorbents could reduce the cost of energy-intensive separation of CO2 from flue gases and industrial streams.” They emphasize that new materials and catalysts can be employed to decrease the costs of CO2 utilization.


     A summary for a CO2 utilization market report by Research and Markets describes the scope of the report: “Multiple product opportunity areas are examined including synthetic hydrocarbon fuels and feedstocks, polycarbonates, polyols, industrial gases, enhanced oil recovery, yield boosting technologies, carbon nanomaterials, and sustainable building products.” The report also addresses regional outlooks for carbon utilization, market challenges, drivers, and industry players.

     I wrote about carbon utilization in my 2022 book: Natural Gas and Decarbonization. There I focused on some current projects as well as the DOE-NETL’s utilization projects, about three-quarters of which were focused on conversion to fuels and chemicals. Only five, or one-eight of the projects were focused on mineral carbonization to produce building products like CO2-imbued concrete and other composite construction materials. I also wrote about the possibility of developing a carbon nanotube and fibers industry to replace the use of metals, which could make products lighter and more durable. The idea was developed by Rice University carbon materials expert Matteo Pasquali. Along with cost, the big hurdle is developing manufacturing capacity for scale-up that can compete with metals manufacturing. Replacing metals with carbon nanomaterials can reduce carbon emissions significantly if such an industry is developed. This is because sources of carbon such as hydrocarbons in the earth are much more concentrated than metal ores. While conversion to chemicals won’t utilize as much carbon as conversion to fuels, there are many chemicals into which CO2 can be converted. I wrote about Lanza Tech’s biological conversion of algae biomass into sustainable jet fuel and their conversion of ethanol into polyester.

     Today, I read about new research to convert CO2 and water into acetylene gas (C2H2), which has many uses including in welding, industrial cutting, metal hardening, heat treatments, and other industrial processes. The idea is to use captured CO2 and water as feedstock rather than fossil fuels. The process requires the use of high-temperature molten salts. The images below show some of the details:


     Another major obstacle to the cost-effective conversion of CO2 into useful products via electrochemical conversion is the breakdown of catalysts under standard operating conditions. Researchers at McMaster University recently published a paper in Nature that used electron microscopy to see within the conversion process to determine how the catalysts break down and to inform strategies that could extend the operational lifetimes of these catalysts, particularly palladium-based catalysts. Just seeing the process at nanoscale is a key development for future improvement. An understanding of catalyst degradation can lead to increasing the stability and operational lifetime of the catalysts.


References:

Researchers reveal elusive bottleneck holding back global effort to convert carbon dioxide waste into usable products. Science X staff. Phys.org. February 2024. Researchers reveal elusive bottleneck holding back global effort to convert carbon dioxide waste into usable products (phys.org)

Impact of palladium/palladium hydride conversion on electrochemical CO2 reduction via in-situ transmission electron microscopy and diffraction. Ahmed M. Abdellah, Fatma Ismail, Oliver W. Siig, Jie Yang, Carmen M. Andrei, Liza-Anastasia DiCecco, Amirhossein Rakhsha, Kholoud E. Salem, Kathryn Grandfield, Nabil Bassim, Robert Black, Georg Kastlunger, Leyla Soleymani & Drew Higgins. Nature Communications volume 15, Article number: 938. January 31, 2024. Impact of palladium/palladium hydride conversion on electrochemical CO2 reduction via in-situ transmission electron microscopy and diffraction | Nature Communications

Carbon Utilization Program. U.S. Dept. of Energy. Office of Fossil Energy and Carbon Management. Carbon Utilization Program | Department of Energy

About Carbon Utilization. U.S. Dept. of Energy. National Energy Technology Laboratory. About Carbon Utilization | netl.doe.gov

Utilization of Captured CO2 to Reach 800 Mt by 2044, Finds IDTechEx. IDTechEx. January 23, 2024. Utilization of Captured CO2 to Reach 800 Mt by 2044, Finds IDTechEx (prnewswire.com)

Carbon Dioxide Utilization 2024-2044: Technologies, Market Forecasts, and Players. Eve Pope. IDTechex. January 2024. Carbon Dioxide Utilization 2024-2044: Technologies, Market Forecasts, and Players: IDTechEx

Carbon Capture, Utilization & Storage Technologies Market Outlook 2024 : Trends, Challenges and Key Suppliers Analysis By 2031. Fashion Trend Segment. LinkedIn. March 8, 2024. (21) Carbon Capture, Utilization & Storage Technologies Market Outlook 2024 : Trends, Challenges and Key Suppliers Analysis By 2031 | LinkedIn Report is by 360 Research Reports with link below.   https://www.360researchreports.com/enquiry/request-sample/20311849

Carbon Dioxide (CO2) Utilization Global Market Report 2024-2045: Emerging Concepts Around Mineralization Pathways for Carbon Removal. PR Newswire. January 25, 2024. Carbon Dioxide (CO2) Utilization Global Market Report 2024-2045: Emerging Concepts Around Mineralization Pathways for Carbon Removal (yahoo.com)

Discover 20 Startups advancing Carbon Capture Utilization & Storage (2024). Startus Insights. 20 Startups advancing Carbon Capture Utilization & Storage (2024) (startus-insights.com)

The technological and economic prospects for CO2 utilization and removal. Cameron Hepburn, Ella Adlen, John Beddington, Emily A. Carter, Sabine Fuss, Niall Mac Dowell, Jan C. Minx, Pete Smith & Charlotte K. Williams. Nature volume 575, pages87–97 (2019). The technological and economic prospects for CO2 utilization and removal | Nature

Natural Gas and Decarbonization: Key Component and Enabler of the Lower Carbon, Reasonable Cost Energy Systems of the Future: Strategies for the 2020s and Beyond. Kent C. Stewart. Amazon Publishing 2022.

Advancing towards sustainability: Turning carbon dioxide and water into acetylene. Science X Staff. Phys.org. March 27, 2024. Advancing towards sustainability: Turning carbon dioxide and water into acetylene (msn.com)


Saturday, March 23, 2024

Environmental Risk Transition: Communities with Different Socio-Economic Capabilities Face Different Environmental Risks and Those Risks Show Characteristic Changes with Development and Economic Growth in Societies


     Wikipedia via the WHO and other researchers like Kirk R. Smith, defines environmental risk transition as “the process by which traditional communities with associated environmental health issues become more economically developed and experience new health issues. In traditional or economically undeveloped regions, humans often suffer and die from infectious diseases or of malnutrition due to poor food, water, and air quality. As economic development occurs, these environmental issues are reduced or solved, and others begin to arise. There is a shift in the character of these environmental changes, and as a result, a shift in causes of death and disease.”


Risk Transition Frameworks

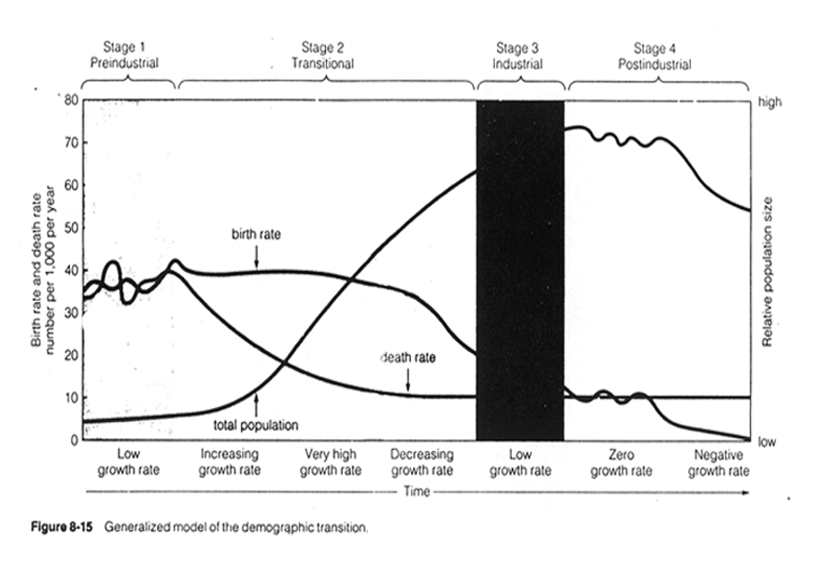
     There are several risk transition frameworks. The earliest to be used is the demographic transition which was used in the 1940’s. The epidemiological transition framework was utilized beginning in 1970. According to Wikipedia: “In 1990, environmental health researcher Kirk R. Smith at the University of California, Berkeley proposed the "risk transition" framework in relation to the established demographic and epidemiological transition frameworks. This theory was based on the concept that there must be a shift in risk factors leading up to a shift in causes of death and disease. In efforts to prevent, rather than respond to diseases, the risk transition was further studied and quantified. Figure 1 shows the relationship between risk, epidemiological, and demographic transition, in which risk factors change to affect patterns of disease and health, which in turn affects the demographic. However, a shift in population also impacts the risk factors, and so these three frameworks all show significant impact on one another.”


Source of above graphs: Wikipedia


     I first came across the idea of environmental protection as a higher-order public good when I read Nordhaus and Shellenberger’s 2007 book Breakthrough in the early 2010s. There, they presented environmental protection as a higher-level need on Maslow’s pyramid or hierarchy of needs. Survival-level needs lower on the pyramid are prioritized by people with very little discretionary cash. As we have seen, clean energy choices are more available to those with discretionary cash. Things like tax credits for things like rooftop solar and EVs that can be redeemed at tax time are taken advantage of by those with the financial means to do so. Thus, those with wealth have been able to take advantage of most of the clean energy incentives for citizens. That means it was and is a benefit that favors the wealthy much more than the poor. However, some of the newer incentives such as those for new and used EVs can be applied immediately to downpayments which makes those incentives more available to those of lesser economic means.  

     Wealth is an enabler of environmental protection. When our lower needs are met, we can approach higher orders of utilitarian goods such as environmental protection. Environmental protection is also viewed by many as a duty. One might fulfill that duty by being optimally educated, and understanding the issues and the science behind them.


     Another way environmental risk transition has been described is as follows:

•       This term characterizes changes in environmental risks that happen as a consequence of economic development in the less developed regions of the world.

•       Before transition occurs: poor food, air, and water quality 


     The environmental risk transition precedes the epidemiologic and demographic transitions. This means that environmental risk precedes epidemiologic and demographic risks since it is much higher in the form of the more dangerous traditional risks vs. modern risks. Traditional risks are more oriented to survival than modern risks. The graphs show a trend of traditional risks transitioning downward while modern risks begin to rise. The areas of the graphs where the two risk types converge are known as risk overlap. This is where risks transition into new forms: risk genesis. This is also where risks can be transferred when attempts to control one type of risk can increase risks of other types. This is known as risk transfer.  Here, risk synergism can also occur where one type of risk changes sensitivity to other risks. The graphs below are form a power point presentation I found at a Health Dept. I work for. I am not sure of the origin. 


     Wealth helps people to better mitigate natural environmental hazards such as contagious infections and parasites, dust, dampness, woodsmoke, pollen, and other airborne hazards, injuries from falls, fires, and animals, and heat, cold, rain, snow, wind, natural disasters, and other adverse conditions. Once these natural hazards are reduced those societies can focus more on higher-order public goods such as environmental protection from anthropogenic hazards like pollution from power plants and factories, greenhouse gas emissions, sanitation, remediation of contamination, and better prevention and reduction of air, water, and soil pollution.


Environmental Risk Transition Theory and Urban Health Inequities


     A study published in Social Science and Medicine in May 2021 titled Adapting the environmental risk transition theory for urban health inequities: An observational study examining complex environmental riskscapes in seven neighborhoods in Global North cities sought to “understand how environmental injustice, urban renewal and green gentrification could inform the understanding of epidemiologic risk transitions.” The graph below summarizes changing environmental health exposures among affected urban populations.


     Much of the study’s data was provided through interviews with affected residents, which is valid but such methods can be strongly biased due to the interviewees feeling cheated by their exposures:


Respondents reported renewed, complexified and overlapping exposures leading to poor mental and physical health and to new patterns of health inequity. Our findings point to the need for theories of environmental and epidemiologic risk transitions to incorporate analysis of trends 1) on a city-scale, acknowledging that segregation and patterns of environmental injustice have created unequal conditions within cities and 2) over a shorter and more recent time period, taking into account worsening patterns of social inequity in cities.”


     The paper makes a recommendation to zoom in with such studies to smaller and more specific populations over shorter time periods. The authors suggest that environmental risk theory and epidemiological risk theory miss some of the important aspects of environmental health, in particular the higher environmental exposures of some populations. I do object to the term environmental racism. While there was no doubt such activity in the past, especially in regard to environmental justice communities being over exposed to certain risks and pollutants, I think there is very little evidence of that happening in modern times. I still think nearly all of these environmental justice communities are legacy communities, exposed due to past actions that have been largely corrected. There may be a few cases here and there, but it is mostly not an issue these days.   


Our results have important implications for epidemiologic theory and methods. We find that studying epidemiologic risk transitions on a finer geographical scale and over shorter timeframes than traditional theories linking risk transitions to larger-scale development illuminates important nuances to identifying risks that contribute to socio-spatial health inequity in cities. Theories of epidemiologic transition have described the evolution of causes of morbidity and mortality as populations move through phases of development, often emphasizing the contribution of riskscapes in urban settings as exposures are modified via urbanization. However, the epidemiologic and environmental risk transition frameworks fail to identify more finite patterns resulting from exposure to persistent, transitional, new, and emerging environmental risks which are inequitably distributed within cities inequalities due to the ongoing impact of environmental racism (Friel et al., 2011). Failing to account for the resulting overlapping and synergistic risk factors, as often happens using a traditional epidemiologic approach, may lead to an underestimation of a population's true burden of exposure and to the inability of cities to address historic and new health injustices.”


Environmental Kusnets Curves

     In the 1950s and 1960s economist Simon Kusnets developed a hypothesis that stated that “as an economy develops, market forces first increase and then decrease economic inequality.”  The original Kusnets Curve shown below, developed around 1960, was concerned with inequity and increasing wealth. It has been strongly criticized and many say invalidated due to the fact that inequality has increased in many societies since 1960 even though it had dropped through the first half of the 20th century. However, Kusnets curves such as the environmental Kusnets curves that show pollution or environmental impact vs. wealth are still considered by many to be valid models.


     According to Majeti Narasimha Vara Prasad in the 2024 book, Bioremediation and Bioeconomy:


     “The Environmental Kuznets curve suggests that economic development initially causes deterioration in the environment. Later due to economic growth, society begins to improve the relationship with the environment, and environmental degradation reduces. Thus, the economic growth is good for the environment. Nevertheless, critics are of the view that there is no guarantee that the economic growth will lead to an improved environment—in fact, the opposite is often the case. At the least, it requires a very targeted policy and attitudes to make sure that economic growth is compatible with an improving environment.”


     Environmental Kusnets curves seem to be generally valid models for some pollutants, some ecological impacts, carbon footprints, and waste products such as sewage. Decoupling of these things from economic growth is confirmed, which is part of the curve trajectory pattern. We are close to peak emissions, peak pollution, and peak other waste products. Wealth is a huge factor in these successes. So too is technological improvement, which also tracks well with wealth.


     A January 2024 paper in Nature: Humanities and Social Sciences Communications by Qiang Wang, Xiaowei Wang, Rongrong Li and Xueting Jiang, titled Reinvestigating the environmental Kuznets curve (EKC) of carbon emissions and ecological footprint in 147 countries: a matter of trade protectionism, aimed to validate the EKC hypothesis, with success when the variables of economic growth, environmental degradation/improvement, and trade protectionism are compared statistically and graphically.

     From the study’s conclusion:


This study conducted a comprehensive investigation into the intricate relationship between economic growth, trade protectionism, and environmental indicators across 147 countries, segmented into four income groups. The utilization of the Pedroni cointegration test further validated the existence of stable long-term correlations between carbon emissions, ecological footprint, and other variables, establishing the groundwork for nuanced regression analyses. Notably, the study pioneered the exploration of threshold effects, unveiling non-linear relationships between trade, economic growth, and environmental outcomes across income groups. The elucidation of threshold models revealed intriguing insights, showcasing varying impacts of trade on economic growth, carbon emissions, and ecological footprints. Particularly noteworthy were the distinct thresholds identified across income groups, delineating changes in the relationships between trade, economic growth, and environmental impacts. These findings underscored the nuanced nature of economic development’s impact on environmental degradation, supporting theories such as the EKC within specific income brackets while uncovering divergences in others.”


Environmental Risk Assessment, Risk Management, Risk Perception, Risk Education and Risk Awareness


     The nexus of humans and risk is multifaceted and sometimes counterintuitive. There is often a mismatch between real risk and perceived risk. Both human psychology and neurobiology are at play in our interfacing with risk. Danger invites fight-flight-freeze reactions at the amygdala level in our pre-logic emotional circuit. The mismatch is known as the risk gap (between real and perceived risk). Risk assessment is important as a necessary early step that precedes and supports risk management. There are many factors that influence human risk perception including media, media trends, news events, past events, and the different types of risks. Some risks are misperceived due simply to lack of knowledge about them. In these cases, the risk gap is simply a knowledge gap. A recent study about PFAS (per- and polyfluoroalkyl substances), also known as forever chemicals, found that 76% of people surveyed by Texas Water Resources Institute knew nothing about PFAS chemicals. 41.5% of respondents had not heard of them and 31.6% of respondents had heard of them but were unaware of the risks. 11.5% of respondents were aware of PFAS contamination. 97.4% of respondents did not believe their own drinking water had been affected. For several years now I have been hearing about PFAS chemicals as emerging contaminants in environmental circles. The results of the survey are an example of risk awareness, in this case lack of awareness about the risks, which possibly include cancer and reproductive problems. Research has confirmed that many people have been exposed to PFAS chemicals. Risk education can help to increase risk awareness. Risk misperceptions can lead to focusing resources on the wrong variables, ones that don’t best help to solve problems.


References:


Environmental Risk Transition. Wikipedia. Environmental risk transition - Wikipedia

Adapting the environmental risk transition theory for urban health inequities: An observational study examining complex environmental riskscapes in seven neighborhoods in Global North cities. Helen V.S. Cole, Isabelle Anguelovski, James J.T. Connolly, Melissa García-Lamarca, Carmen Perez-del-Pulgar, Galia Shokry, and Triguero-Mas. Social Science & Medicine. Volume 277, May 2021, 113907. Adapting the environmental risk transition theory for urban health inequities: An observational study examining complex environmental riskscapes in seven neighborhoods in Global North cities - ScienceDirect

Bioremediation and Bioeconomy: A Circular Economy Approach. Book • Second Edition • 2023. Bioremediation and Bioeconomy | ScienceDirect

Reinvestigating the environmental Kuznets curve (EKC) of carbon emissions and ecological footprint in 147 countries: a matter of trade protectionism. Qiang Wang, Xiaowei Wang, Rongrong Li & Xueting Jiang. Humanities and Social Sciences Communications volume 11, Article number: 160 (2024) January 24, 2024. Reinvestigating the environmental Kuznets curve (EKC) of carbon emissions and ecological footprint in 147 countries: a matter of trade protectionism | Humanities and Social Sciences Communications (nature.com)

The Environmental Risk Transition. Power Point Presentation. (unknown origin)

Kusnets curve. Wikipedia. Kuznets curve - Wikipedia

Researchers raise concerns after surveying Americans about common risks: ‘A significant knowledge gap’. Laurelle Stelle. The Cool Down. March 17, 2024. Researchers raise concerns after surveying Americans about common risks: ‘A significant knowledge gap’ (msn.com)


Sunday, March 10, 2024

Important Northeast Minnesota Helium Discovery Confirmed and Updates on Helium and Hydrogen Projects in Tanzania and South Australia


The Topaz Project in Minnesota’s Iron Range


     Pulsar Helium, Inc. tested an appraisal well at its Topaz Project in Northeast Minnesota at 12.4% helium and it could be the biggest Helium concentration discovery in the U.S. The deposit was actually discovered in 2011 with other shows of inert gas having been recorded in the Iron Range region as well. N2 and CO2 are also present in the area. The appraisal well was drilled to 2200 ft.  

     I did a long post back in December about Helium called Helium Exploration: State of the Science: Geology, Reserves, Economics, and Some Plays and Prospects . In that post I mentioned some possibilities along the Mid-Continent Rift System, part of which runs through Eastern Minnesota. This play would confirm the potential of the rift system, which has an extensive range. Exploration for helium and natural hydrogen is ongoing with active projects in Kansas and Nebraska.  

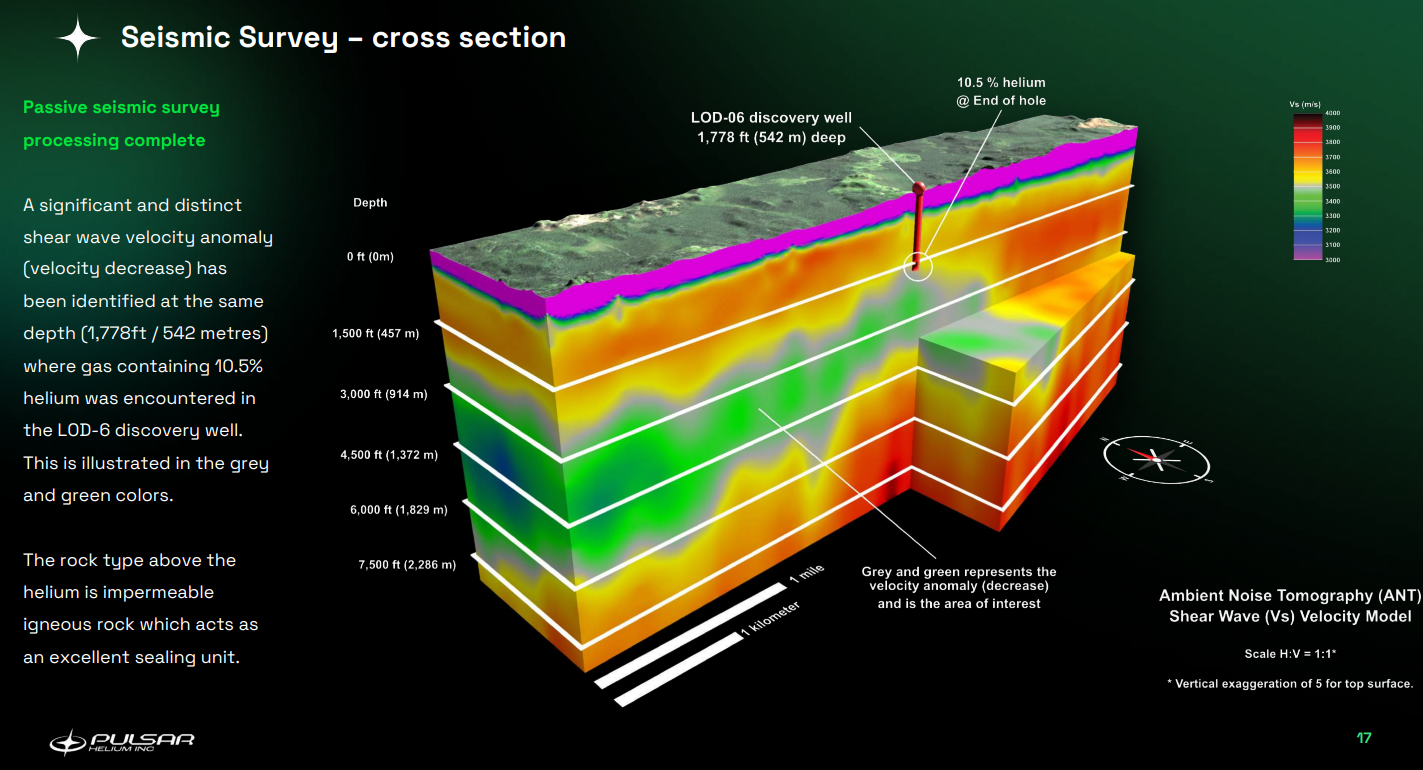
     The following slides from Pulsar’s latest corporate presentation explain the discovery, helium reserves, pricing, uses, and market factors.


Pulsar plans to have a feasibility study conducted by an independent third party “to study the size of the well and whether it could support a full-service helium plant.” That process may take till the end of the year, they say.  Helium is currently in short supply and commands a high price so development of confirmed new resources could be quite helpful in both securing supply and perhaps in time, lowering the prices. Helium is best used near to where it is produced. Northeast Minnesota is a two-day drive or less to most places in the U.S. Helium is a small molecule and leakage rates can be high when it is shipped internationally over long periods of time.


Update on Helium One’s project in Tanzania


     On March 7, Helium One provided an anticipated update on well testing results for their Tanzania helium project. A drill stem test (DST) of the Itumbula West-1 well measured a minimum flow rate of 0.5 million cubic feet per day, with a helium concentration of 4.7%.


"The company's focus is now on appraising and evaluating the resource potential at Itumbula West-1," chief executive Lorna Blaisse said in a statement.


Whilst progressing the subsurface work, to better understand the resource estimates in a fractured Basement and fault play, we are planning the next phase of operations.”


“An extended well test at site will enable us to confirm commercial flow rates and fluid composition, whilst continuing to plan for development and production scenarios in parallel.”


The company’s owned drilling rig is awaiting its next hole.


The Ramsay Natural Hydrogen and Helium Project; Yorke Peninsula, South Australia


     Meanwhile, on the Yorke Peninsula in South Australia, company Gold Hydrogen is beginning to test their recent exploratory wells, Ramsay 1 and Ramsay 2, which confirmed historical data. The wells found natural hydrogen at up to 86% purity and helium at up to 6.8% of raw gas. The wells are providing valuable gas samples for lab analysis. “The data will provide a better understanding of the characteristics of the natural hydrogen and helium reservoirs, including an understanding of potential wellbore skin damage from drilling.” Gold Hydrogen claims the area has “large-scale potential” and that may well be the case. “The independent best estimate prospective resource for natural hydrogen on PEL 687 is 1.3 billion kilograms and for helium, the mean estimated prospective resource is 96 billion cubic feet (Bcf) over around 25% of the tenement.” Future plans include more wells to be drilled and more 2D seismic for 2024, completion designs to be worked out, and plans for pilot production and further commercialization. The company does note that natural hydrogen production is very new. Producing both natural hydrogen and helium together will likely have both advantages and challenges.


References


"A dream. It's perfect": Helium discovery in northern Minnesota may be biggest ever in North America. Jonah Kaplan. Updated on: February 29, 2024. CBS Minnesota. "A dream. It's perfect": Helium discovery in northern Minnesota may be biggest ever in North America - CBS News


Pulsar Helium Inc. Corporate Presentation. February 20, 2024. 65d652fee855ca9a90c2b8af_Pulsar_corp_deck_20Feb24_FINAL-compressed.pdf (website-files.com)


Helium One reveals rates from Itumbula as it advances to appraisal phase. Proactive. March 7, 2024. Helium One reveals rates from Itumbula as it advances to appraisal phase | AIM:HE1, OTCQB:HLOGF (proactiveinvestors.com.au)


Gold Hydrogen begins testing natural hydrogen and helium exploration well at Ramsay Project. Meagan Evans. Proactive. March 5, 2024. Gold Hydrogen begins testing natural hydrogen and helium exploration well at Ramsay Project (proactiveinvestors.com.au)

     Just when you thought you couldn’t possibly be more disgusted by billionaires, there’s this. I think it hurts just to read about it. ...