The first chart
comes from the Energy Institute’s 2024 Statistical Review of World Energy. It is a chart of global coal consumption by region,
and it shows very clearly that the Asia Pacific region is using the most coal
by a wide margin. Much of that coal is used in China to make batteries, solar,
wind, and EV parts that are sold to the U.S. and other countries trying to lead
the energy transition. It is a point of hypocrisy that coal is powering the
energy transition to such a degree.
The second chart comes from Bjorn Lomborg and shows U.S. population
growth in hurricane-prone areas. Lomborg and others have argued for years now
that this is the main reason so-called climate change costs are increasing. The
same is true to a lesser degree in wildfire-prone areas.
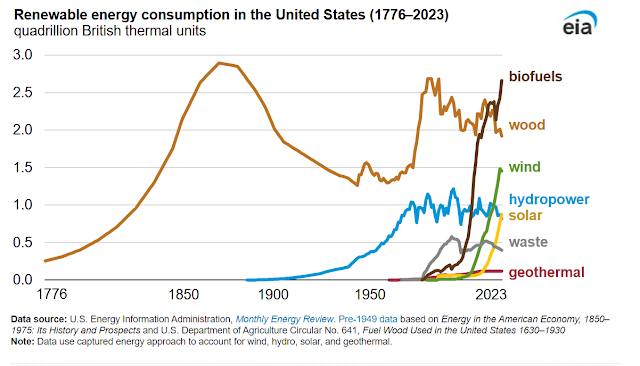
The third and fourth charts are from the U.S. Energy
Information Administration and show the history of U.S. energy use by energy source
and the history of U.S. renewable energy use by energy source. The first chart exemplifies
that fossil fuels are still running our country by a wide margin. The 2nd
chart shows that while increases in wind and solar deployment may be impressive,
we still derive more energy from burning wood than we do from wind and about
twice as much from wood as solar. We use as much solar energy as we did energy
from wood around 1800. More sobering news for those who think a fast energy transition
is actually occurring.
References:
2024/73rd
Edition Statistical Review of World Energy. Energy Institute. June 2024. Statistical
Review of World Energy (1).pdf
Welfare
in the 21st century: Increasing development, reducing inequality, the impact of
climate change, and the cost of climate policies. Bjorn Lomborg. Technological
Forecasting and Social Change. Volume 156, July 2020, 119981. Welfare
in the 21st century: Increasing development, reducing inequality, the impact of
climate change, and the cost of climate policies - ScienceDirect
How
has energy use changed throughout U.S. history? Energy Information
Administration. Today in Energy. July 3, 2024. How
has energy use changed throughout U.S. history? - U.S. Energy Information
Administration (EIA)


No comments:
Post a Comment