Sunday, March 31, 2024

Update on Carbon Utilization: Economics, Projects, Challenges, and Forecasts


     The utilization of captured carbon is an important component of decarbonization. Currently, the vast majority of utilized captured CO2 is used for enhanced oil recovery. That is about to change according to forecasts. Due to tech advancements and generous incentives from the Bipartisan Infrastructure Bill and the IRA the U.S. is on the verge of increasing the utilization of captured CO2. The DOE’s Office of Fossil Energy and Carbon Management developed a grant program in 2022, their Carbon Utilization Program, that “is designed to establish a grant program for state and local governments to procure and use products derived from captured carbon oxides.” Initial funding was $310 million.
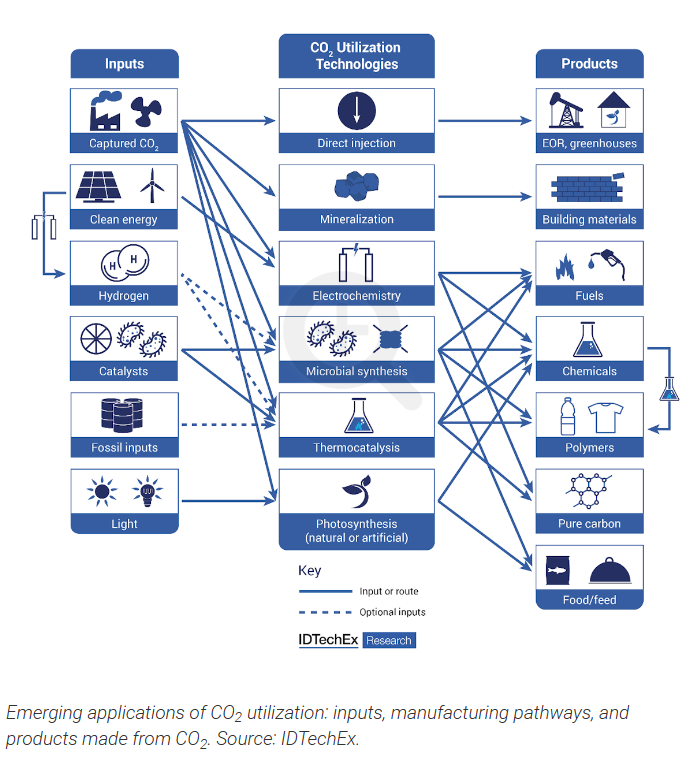
 Currently, there are many start-ups focused on developing economic solutions to carbon capture, removal, utilization, and storage. Some of these may be able to take advantage of such grants to further develop those solutions.

     The graph below shows the different carbon utilization possibilities. Aquaculture can utilize carbon in biomass to yield algae through dewatering, to yield biochar, biogas/syngas, or biocrude through conversion, or to yield lipids, proteins, or carbohydrates through fractionation. Through carbonization, carbon can be converted to inorganic materials which can yield biocarbonates, carbonate aggregates, carbon cements, and other inorganic materials and chemicals. Carbon can be converted into fuels and organic chemicals via two methods: biotic synthesis and abiotic synthesis. Biotic synthesis can yield neat fuels and blendstocks, commodity, specialty, and fine chemicals, and emerging biochemicals. Abiotic synthesis can yield comm oddity, specialty, and fine chemicals through carbon insertion. Through carbon coupling abiotic synthesis can yield C2 basic chemicals, graphite, and carbon. Through C1 reforming abiotic synthesis can yield CO, syngas, and C1 basic chemicals. Captured carbon can also be used as a working fluid to provide services, mainly for improved resource recovery. Crude oil, natural gas, coalbed methane, groundwater, wastewater, and geothermal energy can all utilize CO2 as a working fluid to improve recoveries.


Source: US DOE/NETL


     IDTechEx forecasts that the percentage of captured carbon used for enhanced oil recovery will drop from the current 90+% to about 50% by 2044. That does not mean that enhanced oil recovery won’t increase, just that it will be less of the total share of captured carbon utilized. They also forecast that CO2 conversion to fuels and to building materials, in roughly equal measure will dominate the new uses for captured carbon as the graph below shows. Conversion to chemicals and biological products will make up a much smaller share.


      IDTechEx predicts that by 2044, utilization of waste CO2 will reach 800 Mt, creating over 3,000 Mt of useful products. Of course, CO2 converted to fuels and some chemicals and other products will be burned or consumed, re-releasing the captured CO2 to the atmosphere, but without any new CO2 being generated. Other products like CO2-imbued building materials and biochar will be sequestered for a long time. CO2 sequestration into deep saline reservoirs offers the longest-term storage. Government requirements, mandates, new regulatory rules, and incentives are expected to help fuels and building materials to utilize more captured CO2. They also note that CO2 utilization for crop enhancement in greenhouses is expected to grow as new CO2 pipelines are constructed and filled. The graph below shows emerging applications for the utilization of captured CO2. They also note that some chemicals such as CO2-derived polycarbonates are already produced commercially but they do not require very much CO2 to make, and that chemicals that require non-reductive pathways are the most promising due to a smaller energy demand.
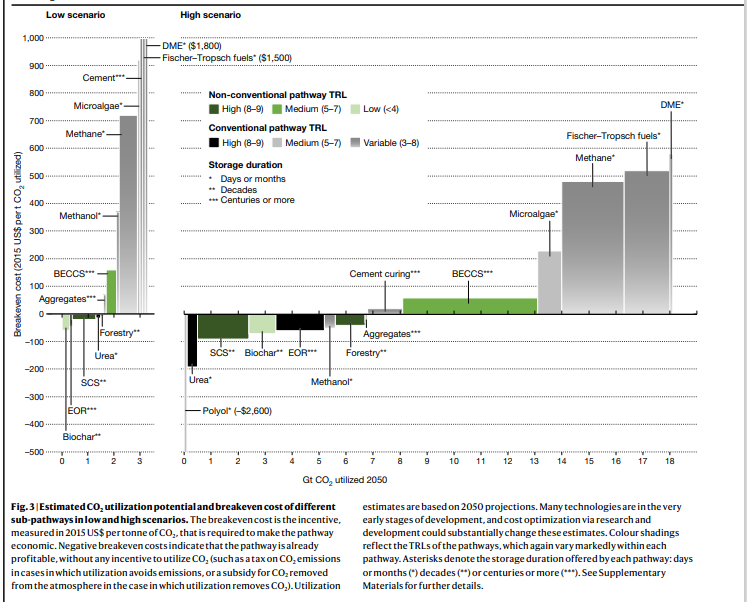


     A paper published in November 2019 in Nature addressed the technological and economic prospects of CO2 utilization and removal. The authors also pointed out some co-benefits od certain utilization pathways. One example is land-based CO2 sequestration into products like biochar can increase agricultural yields and soil health. Another example is that the use of carbon in construction materials can reduce the amounts of other materials required as well as offering a fairly permanent storage solution. The paper provides ten potential utilization pathways that can be scaled up to utilize over 0.5 gigatons of CO2 annually each. The ten pathways are shown in the graphic below of stocks and net flows of CO2 in the environment and in the table below:


CO2 flows from the different types of utilization and removal are shown below.


The last two graphs from the paper address economics and breakeven costs for 2019. Since then, some costs likely have risen due to inflation and higher borrowing costs but that is likely to have been more than offset by new subsidies and incentives as well as some technological improvements. The authors mention a few possible tech improvements that could decrease costs: “The emissions-reduction potentials of the three cycling pathways would be facilitated by declines in the costs of CO2 capture. New sorbents could reduce the cost of energy-intensive separation of CO2 from flue gases and industrial streams.” They emphasize that new materials and catalysts can be employed to decrease the costs of CO2 utilization.


     A summary for a CO2 utilization market report by Research and Markets describes the scope of the report: “Multiple product opportunity areas are examined including synthetic hydrocarbon fuels and feedstocks, polycarbonates, polyols, industrial gases, enhanced oil recovery, yield boosting technologies, carbon nanomaterials, and sustainable building products.” The report also addresses regional outlooks for carbon utilization, market challenges, drivers, and industry players.

     I wrote about carbon utilization in my 2022 book: Natural Gas and Decarbonization. There I focused on some current projects as well as the DOE-NETL’s utilization projects, about three-quarters of which were focused on conversion to fuels and chemicals. Only five, or one-eight of the projects were focused on mineral carbonization to produce building products like CO2-imbued concrete and other composite construction materials. I also wrote about the possibility of developing a carbon nanotube and fibers industry to replace the use of metals, which could make products lighter and more durable. The idea was developed by Rice University carbon materials expert Matteo Pasquali. Along with cost, the big hurdle is developing manufacturing capacity for scale-up that can compete with metals manufacturing. Replacing metals with carbon nanomaterials can reduce carbon emissions significantly if such an industry is developed. This is because sources of carbon such as hydrocarbons in the earth are much more concentrated than metal ores. While conversion to chemicals won’t utilize as much carbon as conversion to fuels, there are many chemicals into which CO2 can be converted. I wrote about Lanza Tech’s biological conversion of algae biomass into sustainable jet fuel and their conversion of ethanol into polyester.

     Today, I read about new research to convert CO2 and water into acetylene gas (C2H2), which has many uses including in welding, industrial cutting, metal hardening, heat treatments, and other industrial processes. The idea is to use captured CO2 and water as feedstock rather than fossil fuels. The process requires the use of high-temperature molten salts. The images below show some of the details:


     Another major obstacle to the cost-effective conversion of CO2 into useful products via electrochemical conversion is the breakdown of catalysts under standard operating conditions. Researchers at McMaster University recently published a paper in Nature that used electron microscopy to see within the conversion process to determine how the catalysts break down and to inform strategies that could extend the operational lifetimes of these catalysts, particularly palladium-based catalysts. Just seeing the process at nanoscale is a key development for future improvement. An understanding of catalyst degradation can lead to increasing the stability and operational lifetime of the catalysts.


References:

Researchers reveal elusive bottleneck holding back global effort to convert carbon dioxide waste into usable products. Science X staff. Phys.org. February 2024. Researchers reveal elusive bottleneck holding back global effort to convert carbon dioxide waste into usable products (phys.org)

Impact of palladium/palladium hydride conversion on electrochemical CO2 reduction via in-situ transmission electron microscopy and diffraction. Ahmed M. Abdellah, Fatma Ismail, Oliver W. Siig, Jie Yang, Carmen M. Andrei, Liza-Anastasia DiCecco, Amirhossein Rakhsha, Kholoud E. Salem, Kathryn Grandfield, Nabil Bassim, Robert Black, Georg Kastlunger, Leyla Soleymani & Drew Higgins. Nature Communications volume 15, Article number: 938. January 31, 2024. Impact of palladium/palladium hydride conversion on electrochemical CO2 reduction via in-situ transmission electron microscopy and diffraction | Nature Communications

Carbon Utilization Program. U.S. Dept. of Energy. Office of Fossil Energy and Carbon Management. Carbon Utilization Program | Department of Energy

About Carbon Utilization. U.S. Dept. of Energy. National Energy Technology Laboratory. About Carbon Utilization | netl.doe.gov

Utilization of Captured CO2 to Reach 800 Mt by 2044, Finds IDTechEx. IDTechEx. January 23, 2024. Utilization of Captured CO2 to Reach 800 Mt by 2044, Finds IDTechEx (prnewswire.com)

Carbon Dioxide Utilization 2024-2044: Technologies, Market Forecasts, and Players. Eve Pope. IDTechex. January 2024. Carbon Dioxide Utilization 2024-2044: Technologies, Market Forecasts, and Players: IDTechEx

Carbon Capture, Utilization & Storage Technologies Market Outlook 2024 : Trends, Challenges and Key Suppliers Analysis By 2031. Fashion Trend Segment. LinkedIn. March 8, 2024. (21) Carbon Capture, Utilization & Storage Technologies Market Outlook 2024 : Trends, Challenges and Key Suppliers Analysis By 2031 | LinkedIn Report is by 360 Research Reports with link below.   https://www.360researchreports.com/enquiry/request-sample/20311849

Carbon Dioxide (CO2) Utilization Global Market Report 2024-2045: Emerging Concepts Around Mineralization Pathways for Carbon Removal. PR Newswire. January 25, 2024. Carbon Dioxide (CO2) Utilization Global Market Report 2024-2045: Emerging Concepts Around Mineralization Pathways for Carbon Removal (yahoo.com)

Discover 20 Startups advancing Carbon Capture Utilization & Storage (2024). Startus Insights. 20 Startups advancing Carbon Capture Utilization & Storage (2024) (startus-insights.com)

The technological and economic prospects for CO2 utilization and removal. Cameron Hepburn, Ella Adlen, John Beddington, Emily A. Carter, Sabine Fuss, Niall Mac Dowell, Jan C. Minx, Pete Smith & Charlotte K. Williams. Nature volume 575, pages87–97 (2019). The technological and economic prospects for CO2 utilization and removal | Nature

Natural Gas and Decarbonization: Key Component and Enabler of the Lower Carbon, Reasonable Cost Energy Systems of the Future: Strategies for the 2020s and Beyond. Kent C. Stewart. Amazon Publishing 2022.

Advancing towards sustainability: Turning carbon dioxide and water into acetylene. Science X Staff. Phys.org. March 27, 2024. Advancing towards sustainability: Turning carbon dioxide and water into acetylene (msn.com)


Saturday, March 23, 2024

Environmental Risk Transition: Communities with Different Socio-Economic Capabilities Face Different Environmental Risks and Those Risks Show Characteristic Changes with Development and Economic Growth in Societies


     Wikipedia via the WHO and other researchers like Kirk R. Smith, defines environmental risk transition as “the process by which traditional communities with associated environmental health issues become more economically developed and experience new health issues. In traditional or economically undeveloped regions, humans often suffer and die from infectious diseases or of malnutrition due to poor food, water, and air quality. As economic development occurs, these environmental issues are reduced or solved, and others begin to arise. There is a shift in the character of these environmental changes, and as a result, a shift in causes of death and disease.”


Risk Transition Frameworks

     There are several risk transition frameworks. The earliest to be used is the demographic transition which was used in the 1940’s. The epidemiological transition framework was utilized beginning in 1970. According to Wikipedia: “In 1990, environmental health researcher Kirk R. Smith at the University of California, Berkeley proposed the "risk transition" framework in relation to the established demographic and epidemiological transition frameworks. This theory was based on the concept that there must be a shift in risk factors leading up to a shift in causes of death and disease. In efforts to prevent, rather than respond to diseases, the risk transition was further studied and quantified. Figure 1 shows the relationship between risk, epidemiological, and demographic transition, in which risk factors change to affect patterns of disease and health, which in turn affects the demographic. However, a shift in population also impacts the risk factors, and so these three frameworks all show significant impact on one another.”


Source of above graphs: Wikipedia


     I first came across the idea of environmental protection as a higher-order public good when I read Nordhaus and Shellenberger’s 2007 book Breakthrough in the early 2010s. There, they presented environmental protection as a higher-level need on Maslow’s pyramid or hierarchy of needs. Survival-level needs lower on the pyramid are prioritized by people with very little discretionary cash. As we have seen, clean energy choices are more available to those with discretionary cash. Things like tax credits for things like rooftop solar and EVs that can be redeemed at tax time are taken advantage of by those with the financial means to do so. Thus, those with wealth have been able to take advantage of most of the clean energy incentives for citizens. That means it was and is a benefit that favors the wealthy much more than the poor. However, some of the newer incentives such as those for new and used EVs can be applied immediately to downpayments which makes those incentives more available to those of lesser economic means.  

     Wealth is an enabler of environmental protection. When our lower needs are met, we can approach higher orders of utilitarian goods such as environmental protection. Environmental protection is also viewed by many as a duty. One might fulfill that duty by being optimally educated, and understanding the issues and the science behind them.


     Another way environmental risk transition has been described is as follows:

•       This term characterizes changes in environmental risks that happen as a consequence of economic development in the less developed regions of the world.

•       Before transition occurs: poor food, air, and water quality 


     The environmental risk transition precedes the epidemiologic and demographic transitions. This means that environmental risk precedes epidemiologic and demographic risks since it is much higher in the form of the more dangerous traditional risks vs. modern risks. Traditional risks are more oriented to survival than modern risks. The graphs show a trend of traditional risks transitioning downward while modern risks begin to rise. The areas of the graphs where the two risk types converge are known as risk overlap. This is where risks transition into new forms: risk genesis. This is also where risks can be transferred when attempts to control one type of risk can increase risks of other types. This is known as risk transfer.  Here, risk synergism can also occur where one type of risk changes sensitivity to other risks. The graphs below are form a power point presentation I found at a Health Dept. I work for. I am not sure of the origin. 


     Wealth helps people to better mitigate natural environmental hazards such as contagious infections and parasites, dust, dampness, woodsmoke, pollen, and other airborne hazards, injuries from falls, fires, and animals, and heat, cold, rain, snow, wind, natural disasters, and other adverse conditions. Once these natural hazards are reduced those societies can focus more on higher-order public goods such as environmental protection from anthropogenic hazards like pollution from power plants and factories, greenhouse gas emissions, sanitation, remediation of contamination, and better prevention and reduction of air, water, and soil pollution.


Environmental Risk Transition Theory and Urban Health Inequities


     A study published in Social Science and Medicine in May 2021 titled Adapting the environmental risk transition theory for urban health inequities: An observational study examining complex environmental riskscapes in seven neighborhoods in Global North cities sought to “understand how environmental injustice, urban renewal and green gentrification could inform the understanding of epidemiologic risk transitions.” The graph below summarizes changing environmental health exposures among affected urban populations.


     Much of the study’s data was provided through interviews with affected residents, which is valid but such methods can be strongly biased due to the interviewees feeling cheated by their exposures:


Respondents reported renewed, complexified and overlapping exposures leading to poor mental and physical health and to new patterns of health inequity. Our findings point to the need for theories of environmental and epidemiologic risk transitions to incorporate analysis of trends 1) on a city-scale, acknowledging that segregation and patterns of environmental injustice have created unequal conditions within cities and 2) over a shorter and more recent time period, taking into account worsening patterns of social inequity in cities.”


     The paper makes a recommendation to zoom in with such studies to smaller and more specific populations over shorter time periods. The authors suggest that environmental risk theory and epidemiological risk theory miss some of the important aspects of environmental health, in particular the higher environmental exposures of some populations. I do object to the term environmental racism. While there was no doubt such activity in the past, especially in regard to environmental justice communities being over exposed to certain risks and pollutants, I think there is very little evidence of that happening in modern times. I still think nearly all of these environmental justice communities are legacy communities, exposed due to past actions that have been largely corrected. There may be a few cases here and there, but it is mostly not an issue these days.   


Our results have important implications for epidemiologic theory and methods. We find that studying epidemiologic risk transitions on a finer geographical scale and over shorter timeframes than traditional theories linking risk transitions to larger-scale development illuminates important nuances to identifying risks that contribute to socio-spatial health inequity in cities. Theories of epidemiologic transition have described the evolution of causes of morbidity and mortality as populations move through phases of development, often emphasizing the contribution of riskscapes in urban settings as exposures are modified via urbanization. However, the epidemiologic and environmental risk transition frameworks fail to identify more finite patterns resulting from exposure to persistent, transitional, new, and emerging environmental risks which are inequitably distributed within cities inequalities due to the ongoing impact of environmental racism (Friel et al., 2011). Failing to account for the resulting overlapping and synergistic risk factors, as often happens using a traditional epidemiologic approach, may lead to an underestimation of a population's true burden of exposure and to the inability of cities to address historic and new health injustices.”


Environmental Kusnets Curves

     In the 1950s and 1960s economist Simon Kusnets developed a hypothesis that stated that “as an economy develops, market forces first increase and then decrease economic inequality.”  The original Kusnets Curve shown below, developed around 1960, was concerned with inequity and increasing wealth. It has been strongly criticized and many say invalidated due to the fact that inequality has increased in many societies since 1960 even though it had dropped through the first half of the 20th century. However, Kusnets curves such as the environmental Kusnets curves that show pollution or environmental impact vs. wealth are still considered by many to be valid models.


     According to Majeti Narasimha Vara Prasad in the 2024 book, Bioremediation and Bioeconomy:


     “The Environmental Kuznets curve suggests that economic development initially causes deterioration in the environment. Later due to economic growth, society begins to improve the relationship with the environment, and environmental degradation reduces. Thus, the economic growth is good for the environment. Nevertheless, critics are of the view that there is no guarantee that the economic growth will lead to an improved environment—in fact, the opposite is often the case. At the least, it requires a very targeted policy and attitudes to make sure that economic growth is compatible with an improving environment.”


     Environmental Kusnets curves seem to be generally valid models for some pollutants, some ecological impacts, carbon footprints, and waste products such as sewage. Decoupling of these things from economic growth is confirmed, which is part of the curve trajectory pattern. We are close to peak emissions, peak pollution, and peak other waste products. Wealth is a huge factor in these successes. So too is technological improvement, which also tracks well with wealth.


     A January 2024 paper in Nature: Humanities and Social Sciences Communications by Qiang Wang, Xiaowei Wang, Rongrong Li and Xueting Jiang, titled Reinvestigating the environmental Kuznets curve (EKC) of carbon emissions and ecological footprint in 147 countries: a matter of trade protectionism, aimed to validate the EKC hypothesis, with success when the variables of economic growth, environmental degradation/improvement, and trade protectionism are compared statistically and graphically.

     From the study’s conclusion:


This study conducted a comprehensive investigation into the intricate relationship between economic growth, trade protectionism, and environmental indicators across 147 countries, segmented into four income groups. The utilization of the Pedroni cointegration test further validated the existence of stable long-term correlations between carbon emissions, ecological footprint, and other variables, establishing the groundwork for nuanced regression analyses. Notably, the study pioneered the exploration of threshold effects, unveiling non-linear relationships between trade, economic growth, and environmental outcomes across income groups. The elucidation of threshold models revealed intriguing insights, showcasing varying impacts of trade on economic growth, carbon emissions, and ecological footprints. Particularly noteworthy were the distinct thresholds identified across income groups, delineating changes in the relationships between trade, economic growth, and environmental impacts. These findings underscored the nuanced nature of economic development’s impact on environmental degradation, supporting theories such as the EKC within specific income brackets while uncovering divergences in others.”


Environmental Risk Assessment, Risk Management, Risk Perception, Risk Education and Risk Awareness


     The nexus of humans and risk is multifaceted and sometimes counterintuitive. There is often a mismatch between real risk and perceived risk. Both human psychology and neurobiology are at play in our interfacing with risk. Danger invites fight-flight-freeze reactions at the amygdala level in our pre-logic emotional circuit. The mismatch is known as the risk gap (between real and perceived risk). Risk assessment is important as a necessary early step that precedes and supports risk management. There are many factors that influence human risk perception including media, media trends, news events, past events, and the different types of risks. Some risks are misperceived due simply to lack of knowledge about them. In these cases, the risk gap is simply a knowledge gap. A recent study about PFAS (per- and polyfluoroalkyl substances), also known as forever chemicals, found that 76% of people surveyed by Texas Water Resources Institute knew nothing about PFAS chemicals. 41.5% of respondents had not heard of them and 31.6% of respondents had heard of them but were unaware of the risks. 11.5% of respondents were aware of PFAS contamination. 97.4% of respondents did not believe their own drinking water had been affected. For several years now I have been hearing about PFAS chemicals as emerging contaminants in environmental circles. The results of the survey are an example of risk awareness, in this case lack of awareness about the risks, which possibly include cancer and reproductive problems. Research has confirmed that many people have been exposed to PFAS chemicals. Risk education can help to increase risk awareness. Risk misperceptions can lead to focusing resources on the wrong variables, ones that don’t best help to solve problems.


References:


Environmental Risk Transition. Wikipedia. Environmental risk transition - Wikipedia

Adapting the environmental risk transition theory for urban health inequities: An observational study examining complex environmental riskscapes in seven neighborhoods in Global North cities. Helen V.S. Cole, Isabelle Anguelovski, James J.T. Connolly, Melissa García-Lamarca, Carmen Perez-del-Pulgar, Galia Shokry, and Triguero-Mas. Social Science & Medicine. Volume 277, May 2021, 113907. Adapting the environmental risk transition theory for urban health inequities: An observational study examining complex environmental riskscapes in seven neighborhoods in Global North cities - ScienceDirect

Bioremediation and Bioeconomy: A Circular Economy Approach. Book • Second Edition • 2023. Bioremediation and Bioeconomy | ScienceDirect

Reinvestigating the environmental Kuznets curve (EKC) of carbon emissions and ecological footprint in 147 countries: a matter of trade protectionism. Qiang Wang, Xiaowei Wang, Rongrong Li & Xueting Jiang. Humanities and Social Sciences Communications volume 11, Article number: 160 (2024) January 24, 2024. Reinvestigating the environmental Kuznets curve (EKC) of carbon emissions and ecological footprint in 147 countries: a matter of trade protectionism | Humanities and Social Sciences Communications (nature.com)

The Environmental Risk Transition. Power Point Presentation. (unknown origin)

Kusnets curve. Wikipedia. Kuznets curve - Wikipedia

Researchers raise concerns after surveying Americans about common risks: ‘A significant knowledge gap’. Laurelle Stelle. The Cool Down. March 17, 2024. Researchers raise concerns after surveying Americans about common risks: ‘A significant knowledge gap’ (msn.com)


Sunday, March 10, 2024

Important Northeast Minnesota Helium Discovery Confirmed and Updates on Helium and Hydrogen Projects in Tanzania and South Australia


The Topaz Project in Minnesota’s Iron Range


     Pulsar Helium, Inc. tested an appraisal well at its Topaz Project in Northeast Minnesota at 12.4% helium and it could be the biggest Helium concentration discovery in the U.S. The deposit was actually discovered in 2011 with other shows of inert gas having been recorded in the Iron Range region as well. N2 and CO2 are also present in the area. The appraisal well was drilled to 2200 ft.  

     I did a long post back in December about Helium called Helium Exploration: State of the Science: Geology, Reserves, Economics, and Some Plays and Prospects . In that post I mentioned some possibilities along the Mid-Continent Rift System, part of which runs through Eastern Minnesota. This play would confirm the potential of the rift system, which has an extensive range. Exploration for helium and natural hydrogen is ongoing with active projects in Kansas and Nebraska.  

     The following slides from Pulsar’s latest corporate presentation explain the discovery, helium reserves, pricing, uses, and market factors.


Pulsar plans to have a feasibility study conducted by an independent third party “to study the size of the well and whether it could support a full-service helium plant.” That process may take till the end of the year, they say.  Helium is currently in short supply and commands a high price so development of confirmed new resources could be quite helpful in both securing supply and perhaps in time, lowering the prices. Helium is best used near to where it is produced. Northeast Minnesota is a two-day drive or less to most places in the U.S. Helium is a small molecule and leakage rates can be high when it is shipped internationally over long periods of time.


Update on Helium One’s project in Tanzania


     On March 7, Helium One provided an anticipated update on well testing results for their Tanzania helium project. A drill stem test (DST) of the Itumbula West-1 well measured a minimum flow rate of 0.5 million cubic feet per day, with a helium concentration of 4.7%.


"The company's focus is now on appraising and evaluating the resource potential at Itumbula West-1," chief executive Lorna Blaisse said in a statement.


Whilst progressing the subsurface work, to better understand the resource estimates in a fractured Basement and fault play, we are planning the next phase of operations.”


“An extended well test at site will enable us to confirm commercial flow rates and fluid composition, whilst continuing to plan for development and production scenarios in parallel.”


The company’s owned drilling rig is awaiting its next hole.


The Ramsay Natural Hydrogen and Helium Project; Yorke Peninsula, South Australia


     Meanwhile, on the Yorke Peninsula in South Australia, company Gold Hydrogen is beginning to test their recent exploratory wells, Ramsay 1 and Ramsay 2, which confirmed historical data. The wells found natural hydrogen at up to 86% purity and helium at up to 6.8% of raw gas. The wells are providing valuable gas samples for lab analysis. “The data will provide a better understanding of the characteristics of the natural hydrogen and helium reservoirs, including an understanding of potential wellbore skin damage from drilling.” Gold Hydrogen claims the area has “large-scale potential” and that may well be the case. “The independent best estimate prospective resource for natural hydrogen on PEL 687 is 1.3 billion kilograms and for helium, the mean estimated prospective resource is 96 billion cubic feet (Bcf) over around 25% of the tenement.” Future plans include more wells to be drilled and more 2D seismic for 2024, completion designs to be worked out, and plans for pilot production and further commercialization. The company does note that natural hydrogen production is very new. Producing both natural hydrogen and helium together will likely have both advantages and challenges.


References


"A dream. It's perfect": Helium discovery in northern Minnesota may be biggest ever in North America. Jonah Kaplan. Updated on: February 29, 2024. CBS Minnesota. "A dream. It's perfect": Helium discovery in northern Minnesota may be biggest ever in North America - CBS News


Pulsar Helium Inc. Corporate Presentation. February 20, 2024. 65d652fee855ca9a90c2b8af_Pulsar_corp_deck_20Feb24_FINAL-compressed.pdf (website-files.com)


Helium One reveals rates from Itumbula as it advances to appraisal phase. Proactive. March 7, 2024. Helium One reveals rates from Itumbula as it advances to appraisal phase | AIM:HE1, OTCQB:HLOGF (proactiveinvestors.com.au)


Gold Hydrogen begins testing natural hydrogen and helium exploration well at Ramsay Project. Meagan Evans. Proactive. March 5, 2024. Gold Hydrogen begins testing natural hydrogen and helium exploration well at Ramsay Project (proactiveinvestors.com.au)

       New research published in Nature Communications involving a global assessment of rapid temperature flips from 1961 to 2100 found tha...

Index of Posts (Linked)