The Statistical Review of World Energy was formerly published by BP and is now published by KPMG and the Energy Institute. The host web page for the report offers five insights from the 2023 report: 1) post-Covid transport fuel demand has mostly returned but is now distributed differently. 2) record high oil, natural gas, and gasoline prices were due to the Ukraine war in 2022 which resulted in unprecedented shifts in global delivery flows of oil and gas. 3) record wind and solar deployment accounted for 84% of net electricity growth. 4) global primary energy grew by 1% with fossil fuels basically unchanged at 82% of the total. 5) global energy-related emissions grew at 0.8% as growth in high-emissions fuels eclipsed strong renewables growth.
Now, late in
3Q 2023, natural gas prices are down to manageable levels. Natural gas storage
fields in Europe are filled at sufficient levels. Oil prices are being levered
by OPEC+, a bit too much for my taste.
Wind and solar deployment are set to continue but there
are issues, including wind companies losing money for different reasons. Supply
chain issues, wind component manufacturing issues, public opposition to projects,
higher costs of the U.S. domestic content requirement, transmission bottlenecks
and grid integration challenges, and permitting and regulatory issues are among
the reasons wind and solar deployment won’t accelerate much faster anytime
soon. The fact that wind and solar covered 84% of net electricity growth, while
quite a lot of deployment, also means that 16% of that growth was likely covered
by fossil fuels, which hardly gives support for those saying we should
eliminate fossil fuels, as does their holding at 82% of primary energy consumption.
I mean, it’s not yet even covering demand growth, let alone replacing fossil
fuels. Loss of nuclear and coal power also has to be covered.
The 2022 growth
in emissions was likely partially related to reactions to the Russian invasion
of Ukraine as countries scrambled to replace Russian pipeline gas with
resources like high-emissions lignite coal in Germany, Poland, and other
countries. Pipeline gas has lower emissions than LNG so the replacement of it
by LNG also led to higher emissions. High natural gas prices in Asia no doubt
led to more burning of coal. That even occurred in the U.S. as plants that are
able always burn more coal when natural gas prices are high. 2022 also saw
record high lithium prices which have since come down to more reasonable
levels.
Suppressed
demand in 2020 and 2021 due to Covid makes it hard to evaluate some of the data
from 2022 since increases in demand and emissions can also be attributed to the recovery of economic activity. Thus, some of the year-over-year changes can be
less meaningful to interpreting overall trends.
Primary energy
consumption continued to increase overall, hitting 600 exajoules for the first time.
The Asia
Pacific region, which includes China and India, continues to increase its
share of primary energy consumption, now approaching 50%, while the share from
North America and Europe continues to decline as a result. This simply reflects
more development needs in the Asia Pacific region, and this trend is expected
to continue.
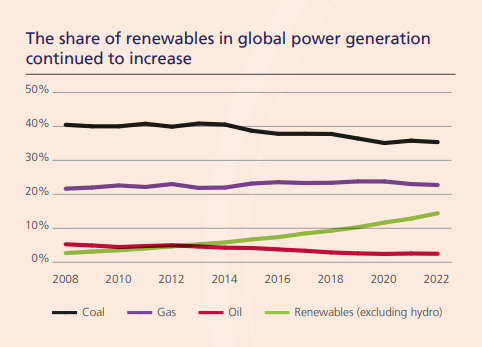
The global
share of wind and solar in global power production continued to rise, reaching 14%.
Coal still leads at 35%, followed by natural gas at 23%. If much of the remaining
coal is to be replaced, much of it will likely be replaced by natural gas as
well as renewables.
In 2022, 18%
of crude oil, 19% of natural gas, and 14% of coal were still bought from
Russia. I would expect those numbers to drop in 2023. However, it has been
reported that Russian LNG sales to Europe have actually risen this year even as
pipeline sales have dropped. Oil, gas, coal, fertilizer, and minerals are key
funders of the Russian economy as well as the Russian war effort against Ukraine.
The data is
given in the report and can be easily graphed to reveal much about energy use
and emissions. I made the following graphs from the data. The first two show several
interesting things. One is that while China and the U.S. dominate primary energy
consumption, China alone dominates CO2 emissions. They show India’s higher CO2
emissions intensity than the U.S. They show the lower CO2 emissions intensity
of especially France, but also of Russia due to nuclear. They show the higher CO2
intensity of Indonesia due to coal and of Japan due to less use of nuclear. They
show the lower CO2 intensity of Canada and Brazil due to hydro.
Natural gas
flaring rates have been dropping in recent years and in most countries dropped
in 2022. The overall data was a bit surprising to me. The graph below shows
that 4 countries: Russia, Iran, Iraq, and Venezuela account for just about half
of global natural gas flaring. The U.S. accounts for just 6% of natural gas
flaring while being the world’s largest producer of crude oil and condensate (14.6%
of global production). See the graph below.
Another
interesting observation is that the U.S. dominates global natural gas liquids
production by a wide margin, producing nearly half of the world’s NGLs and
nearly 4 times that of its nearest competitor, Saudi Arabia.
Installed wind
and solar are dominated by China with the U.S. at a distant second. Germany,
India, and Japan (only on solar) are distant thirds.
The Statistical
Review of World Energy remains a vital and useful resource to evaluate world and
regional energy and electricity production and consumption as well as emissions
associated with energy production and consumption. It gives us an idea of who
is doing what, global trends, and regional trends.
References:
Statistical Review of World Energy. June
2023. Home |
Statistical Review of World Energy (energyinst.org)


No comments:
Post a Comment